RSI-2
 By LuxAlgoJun 17, 2026
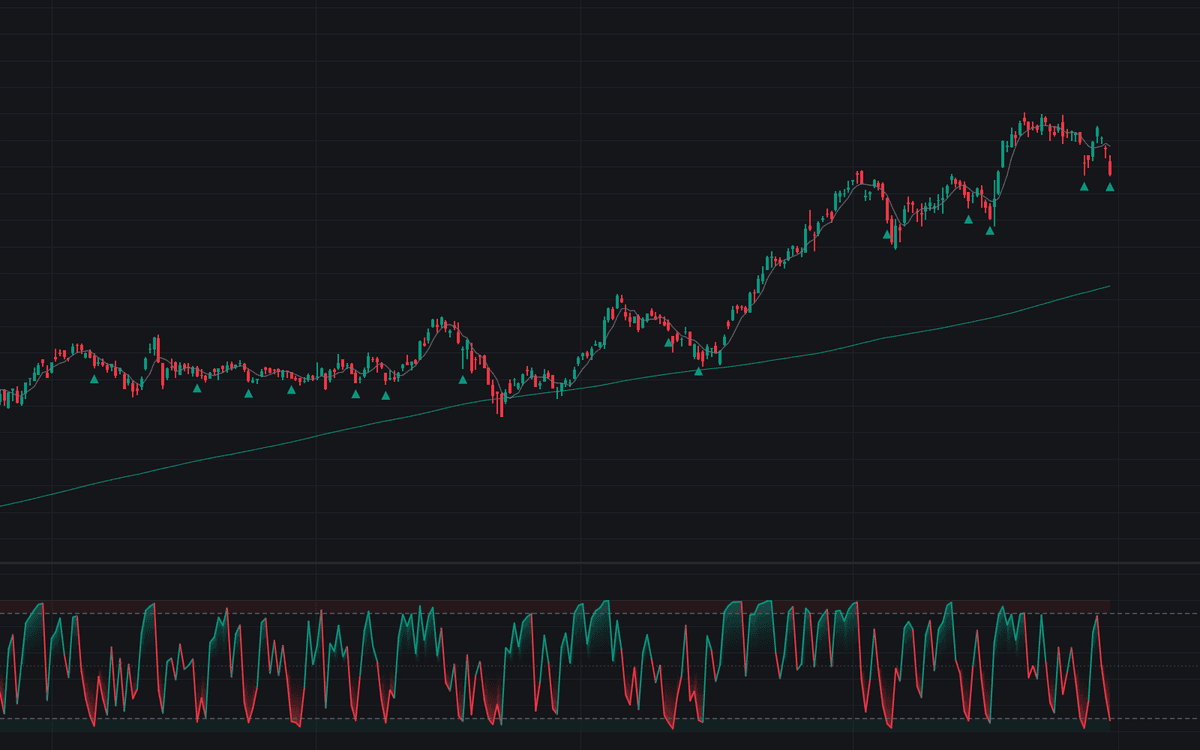

RSI-2 runs Wilder's RSI at a two-bar lookback, turning the oscillator into a fast gauge of short-term stretch, and builds the published mean-reversion workflow around it. The definitive clean build of RSI-2 adds the two price-chart averages the rules call for: a 200-bar trend filter deciding tradable direction, and a 5-bar exit average tracking the resolving close. Setups print as triangles on the price chart; the pane carries 90/10 bands and a gradient fill around the 50 midline.
How to Trade the RSI-2?
- Long setup: RSI-2 stretched below the oversold band with price above the trend filter, buying a routine pullback inside an uptrend.
- Short setup: the mirror image, a stretch above the overbought band with price below the filter.
- Exit: a long resolves on the first close back above the exit average, a short on the first close back below it.
- Raw stretches: the band-crossing alerts fire regardless of regime, usable for scaling out into a spike rather than initiating.
A new setup is only marked once the previous one has resolved through the exit average.
RSI-2 Settings
- RSI Length (default 2) and Source (default close): the oscillator itself.
- Overbought Level (default 90) and Oversold Level (default 10): at a two-bar length the classic 70/30 bands trigger constantly, so the meaningful levels sit further out.
- Consecutive Readings (default 1): closes beyond a band required to qualify a setup; 2 reproduces the stricter two-reading variant.
- Trend Filter Length (default 200): the regime moving average drawn on the price chart.
- Exit Average Length (default 5): the short average the resolution is read against.
- Style toggles draw the trend filter, exit average and setup markers (default enabled) plus exit markers (default disabled), with the Gradient Fill (default enabled).
Frequently Asked Questions

Original indicatorBuilt in-house by LuxAlgo
The Library is free. Quant makes it yours.
Pull any concept or indicator into Quant: rebuild it, retune it, or turn it into a backtested strategy of your own.