Concept
RSI-2
RSI-2, also known as two-period RSI, is a Momentum & Oscillators concept. The Library holds 1 implementation, a working definition you can pull into Quant.
short-lookback mean reversion
Top RSI-2 indicator
The top custom implementation, built on the original standard RSI-2 formula.
1 total
This RSI-2 implementation is strategy-ready: open it in Quant, set your rules, and it backtests automatically.
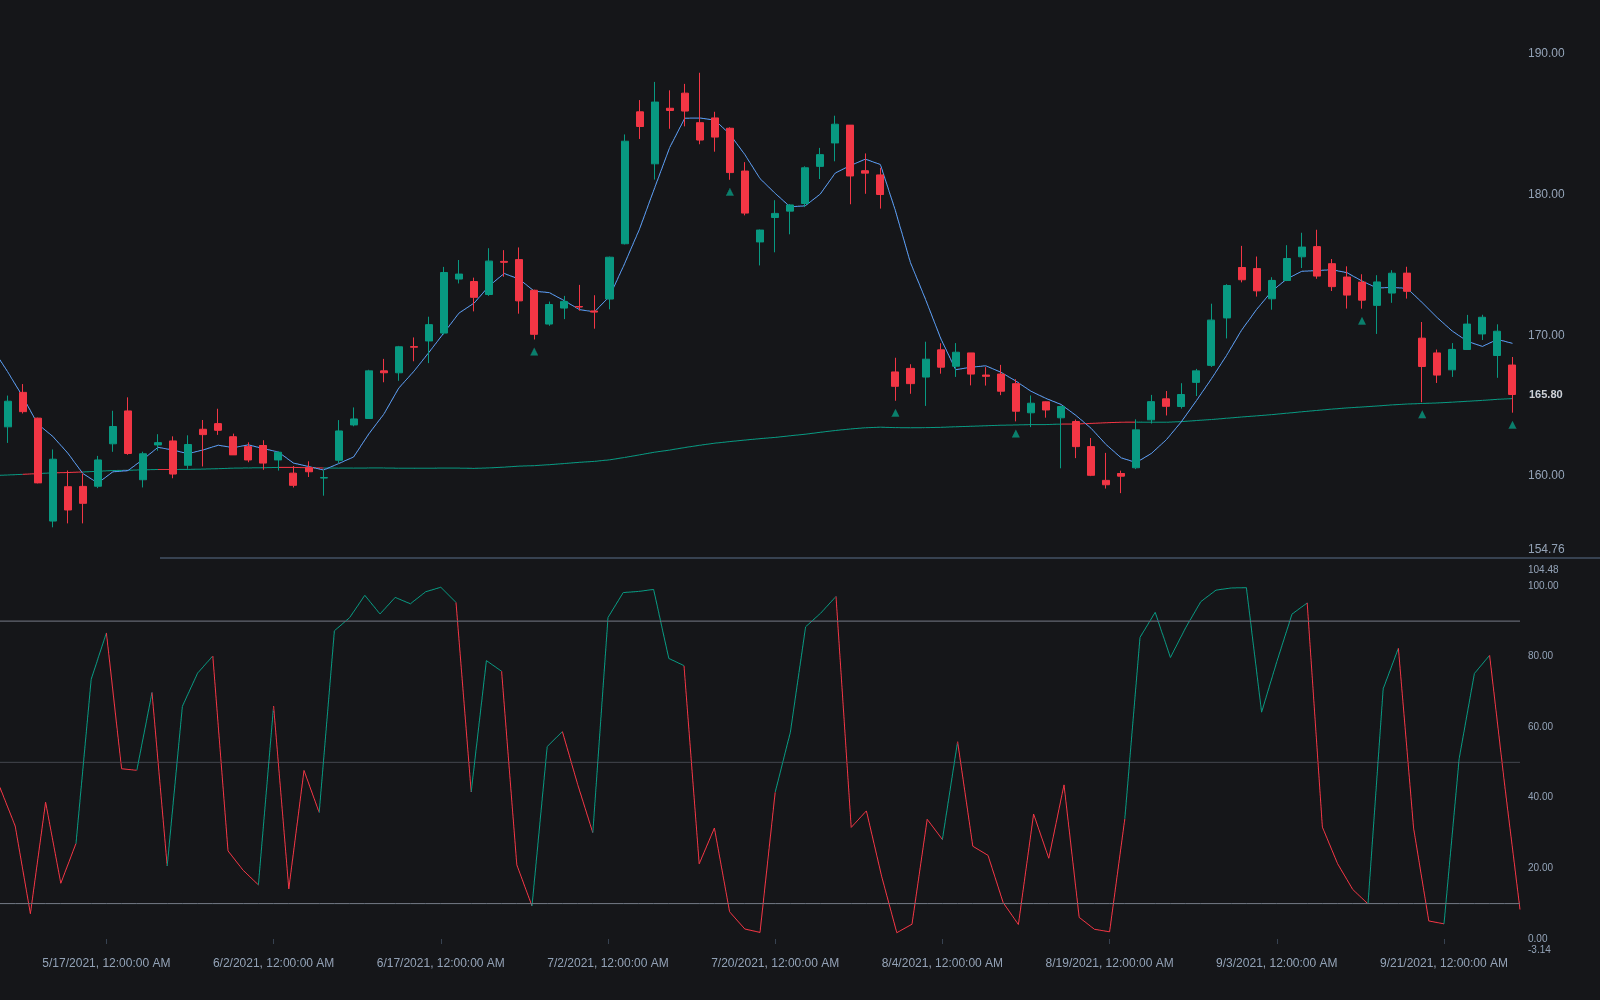
What is RSI-2?
RSI-2 is the standard RSI calculation run with a two-period lookback. At that length the oscillator stops behaving like a trend gauge and becomes a short-term stretch meter: it pushes toward 100 after two strong up closes and toward 0 after two weak ones, so readings reach the extremes far more often than the 14-period default does. Larry Connors popularized the setting as a mean-reversion trigger, arguing that in a persistent uptrend a deeply oversold RSI-2 more often marks a routine pullback than the start of a decline.
The lineage has two names. J. Welles Wilder introduced RSI in New Concepts in Technical Trading Systems (1978) with a 14-period default aimed at swing analysis. Three decades later, Larry Connors and Cesar Alvarez, in Short Term Trading Strategies That Work (2008), published backtests on US index and ETF data arguing that very short lookbacks suited mean reversion far better, with the 2-period version as their flagship. Those results are sample-specific history rather than a law, but they turned RSI-2 from a parameter choice into a named strategy.
The widely published Connors rules show the intended shape of the trade: take longs only when price is above its 200-day simple moving average, enter when RSI-2 closes below a low threshold such as 10 (or 5 for stricter selection), and exit when price closes back above a short average such as the 5-day, or when the oscillator recovers. Exact numbers vary by source; the shared logic is buying short-term weakness inside a long-term uptrend instead of chasing strength. Nothing about the setting ensures the pullback ends; the trend filter exists because sometimes it does not.
The behavior change is pure arithmetic: with only two bars of smoothed gains and losses, one strong close pushes the ratio near an extreme, so readings above 90 or below 10 are routine and the meaningful bands migrate outward. The compression discards most of what slower momentum tools provide: divergence reads like those cataloged under regular bullish/bearish divergence mean little on a line that saturates constantly, and trend confirmation belongs to slower gauges such as MACD. RSI-2 does one job: flagging a two-bar stretch.
How to identify RSI-2 signals on a chart
The setup is standard RSI with the length dropped to 2 and the reference bands moved outward.
- 1Apply RSI with a 2-period length to closes; the plot is jagged, tagging the 0 and 100 regions far more than a 14-period line.
- 2Replace the default 70/30 bands with 90/10, or 95/5 for stricter selection; at a two-period length the defaults are crossed so often they no longer select anything.
- 3Add the regime filter on the price chart, classically the 200-day simple moving average, and note which side price holds.
- 4RSI-2 closing below the lower band with price above the filter marks the dip-buy condition; the mirror above 90 with price below the filter marks the fade.
- 5Track the exit separately, commonly a close above a short average like the 5-day; the entry says nothing about when the bounce ends.
How it's calculated
A 2-period version of Wilder's Relative Strength Index, tuned to flag very short-term overbought and oversold extremes.
The first AvgGain and AvgLoss are seeded with the simple average of the first n gains and losses; when AvgLoss_t = 0 the value is set to 100.
The arithmetic is identical to standard 14-period RSI, only with n = 2, so readings reach extremes far more often.
Popularized by Larry Connors for short-term mean reversion, usually read with thresholds such as 90/10 or 95/5 rather than 70/30.
How traders use it
- As a dip-buying trigger inside a trend filter: with price above a slow moving average, an RSI-2 close below 10 flags the stretched pullback, and the exit is typically a close back above a short average rather than a fixed profit target.
- Mirrored for shorts in downtrends: below the long-term average, RSI-2 readings above 90 or 95 flag two-bar rallies that mean-reversion traders fade.
- In stricter variants that demand a deeper stretch: requiring RSI-2 below 5, two consecutive closes below the threshold, or a cumulative sum of readings before entry.
- As a profit-taking aid: spikes above 90 into resistance are used to scale out of longs, applying the stretch read to exits even when entries came from elsewhere.
- As one member of a fast-trigger family: short-lookback CCI or ROC readings fill the same role in similar systems; the shared design is a tight trigger window plus a slow directional filter.
RSI-2 vs related oscillators
RSI: The parent oscillator at its default 14-period length is read for trend strength, ranges, and divergence. RSI-2 is the same formula compressed until it measures only a two-bar stretch, which is why its meaningful bands move from 70/30 out to 90/10 or 95/5.
Stochastic RSI: Both reach extremes far more often than standard RSI: RSI-2 shortens the lookback, while Stochastic RSI keeps a longer RSI and re-scales it within its recent range. StochRSI stays a general-purpose oscillator; RSI-2 is used almost purely as a mean-reversion trigger.
Stochastic Oscillator: A fast stochastic is the classic alternative dip trigger: it locates the close within the recent high-low range where RSI-2 measures the last two bars' gain-loss balance. In mean-reversion systems the two are near-interchangeable; both need a regime filter to avoid fading genuine declines.
Concept family
Momentum & Oscillators
91 concepts mapped · 91 in the Library
RSI-2 FAQ
Turn RSI-2 into a trading strategy.
Take the implementation from this page into Quant, then build on it, backtest it on real data, and keep refining it in conversation.