RSI of Other Sources
 By LuxAlgoMar 6, 2026
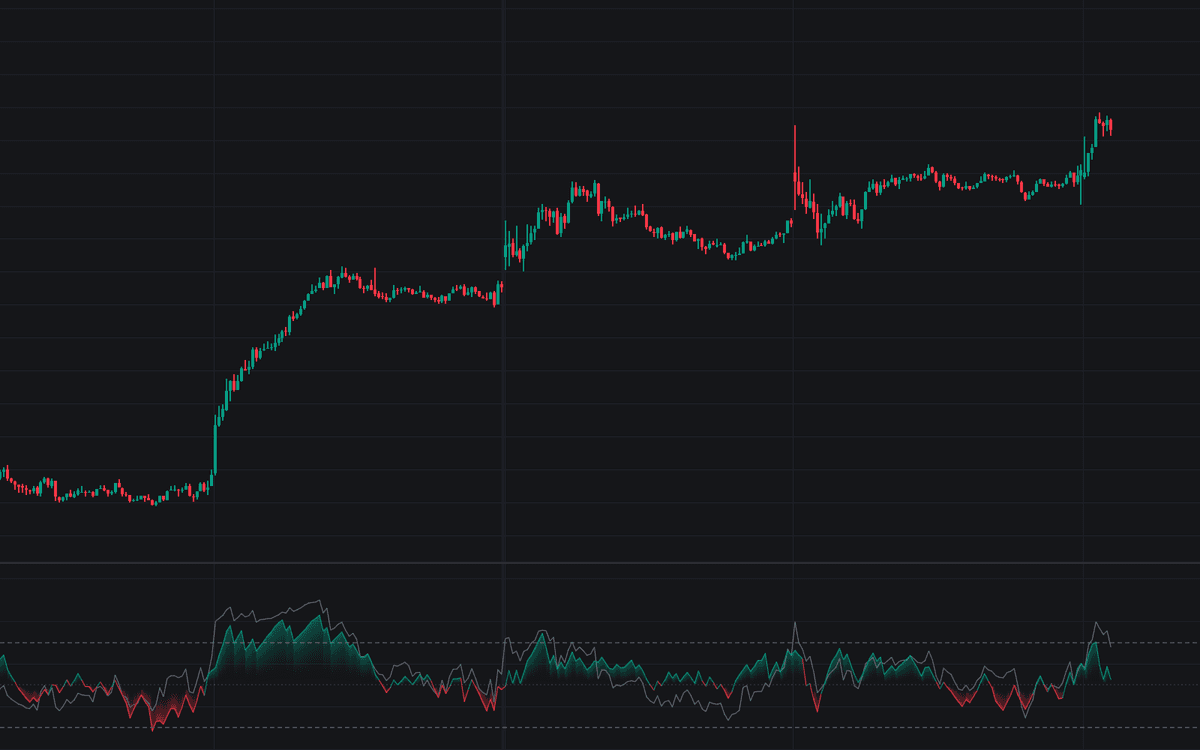

RSI of Other Sources is the definitive clean take on RSI of other sources: Wilder's formula, unchanged, pointed at whatever series you select. On-Balance Volume is the default; Volume, VWAP Distance, Momentum, Rate of Change, another symbol's close, or any custom plot can take its place. The derived line sits on the familiar 0-100 scale, colored by its side of 50 with a gradient fill, next to a muted Price RSI of the same length so the two reads compare at a glance.
How to Trade the RSI of Other Sources?
- Midline crosses: the derived RSI above 50 means bar-to-bar changes in the selected series are tilting positive. With OBV selected, that is volume flow expanding, not price rising.
- Derived vs Price RSI splits: when the two lines disagree, the price move lacks support from the selected series, the disagreement this tool exists to surface.
- Overbought / Oversold crossings: entries into and exits from the dashed threshold zones, remembering every source keeps its own extremes.
Six alerts cover both midline crosses plus entry and exit at each threshold.
RSI of Other Sources Settings
- Applied To (default On-Balance Volume): the series the RSI formula runs on.
- RSI Length (default 14): Wilder smoothing lookback, shared by the comparison line.
- Custom Source (default close): used by the Custom Source option and as the base for Momentum and Rate of Change.
- Momentum/ROC Length (default 10).
- Other Symbol (default empty, meaning the chart symbol).
- Input Smoothing (default None, length 14): optional SMA/EMA/WMA/RMA applied before gains and losses are measured.
- Overbought (default 70) / Oversold (default 30).
- Price RSI Comparison and Gradient Fill are on by default.
Frequently Asked Questions

Original indicatorBuilt in-house by LuxAlgo
The Library is free. Quant makes it yours.
Pull any concept or indicator into Quant: rebuild it, retune it, or turn it into a backtested strategy of your own.