


Session Gap Fill
Oct 8, 2025
The Session Gap Fill trading indicator is a powerful tool designed to automatically detect and highlight filled and unfilled price gaps between regular trading sessions. It helps traders visually identify areas of strong market sentiment changes and provides a comprehensive dashboard showing detailed statistics about gap behavior and probabilities. Whether you're a day trader or swing trader, this indicator can help you understand how price gaps influence market direction and momentum.
How to Trade the Session Gap Fill Trading Indicator
By default, the Session Gap Fill indicator scans all price gaps occurring between sessions. A price gap forms when there’s a difference between the opening price of one session and the closing price of the previous one. In this case, the tool uses the first bar’s open and the last bar’s close to detect gaps.
- Bullish Gaps: When the session’s open price is higher than the previous close.
- Bearish Gaps: When the session’s open price is lower than the previous close.
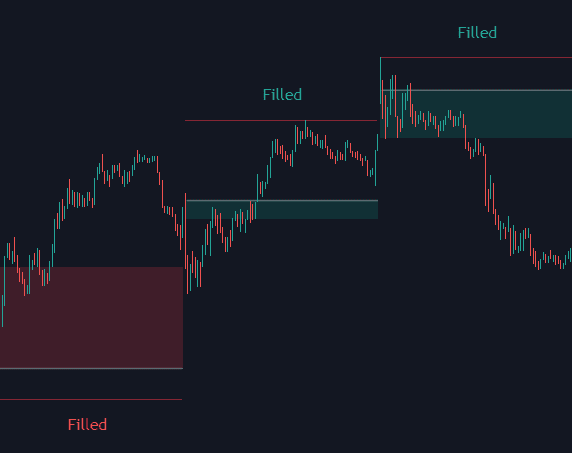
Price gaps often indicate a sudden shift in market sentiment — a difference in trader perception from one session to the next. However, what truly matters for traders isn’t just the gap’s existence, but how the market reacts to it afterward.
- Unfilled Gaps occur when the market does not return to the previous session’s close.
- Filled Gaps occur when the market retraces to the previous session’s close price.
By studying how gaps behave — whether they fill quickly or remain open — traders can assess market acceptance or rejection of certain price levels and position themselves accordingly with the prevailing bullish or bearish momentum.
Gap Type Filter: Analyzing Overlapping vs Non-Overlapping Gaps
The Gap Type Filter allows traders to refine their analysis by selecting which kinds of gaps to visualize:
- All Gaps: Displays every detected gap.
- Overlapping Gaps: When the first bar of the new session shares any price level with the previous bar.
- Non-Overlapping Gaps: When the two bars do not share any common price levels.
This distinction matters because markets often behave differently around these two types. Overlapping gaps typically fill more quickly due to immediate price interaction, while non-overlapping gaps can represent stronger, more decisive shifts in sentiment.
Understanding the Statistics Dashboard
The Statistics Dashboard helps traders visualize and quantify how the market behaves around gaps, giving a data-driven edge to session analysis. It includes key metrics such as:
- Gaps: Percentage of bullish vs. bearish gaps.
- Filled: Percentage of bullish and bearish gaps that have been filled.
- Reversed: Percentage of filled gaps where price reverses in the direction of the original gap.
- Bars Avg.: Average number of bars required for a gap to be filled.
Let’s look at an example based on the chart shown above:
- Bullish Gaps: 55%
- Bearish Gaps: 44%
- Filled Gaps: 63% — meaning most gaps are filled.
- Reversed After Fill: 35% (bullish) and 29% (bearish) — showing limited reversal probability.
- Bars Avg.: Between 1–2 bars for a gap to be filled — indicating quick reactions.
Interestingly, overlapping gaps have a >90% probability of filling, while non-overlapping gaps fill less than 40% of the time, emphasizing how different types of gaps carry unique predictive qualities.
Settings Overview
The Session Gap Fill indicator is fully customizable, giving traders full control over its visual display and analytical depth.
Gap Type
- Gap Type: Choose between all, overlapping, or non-overlapping gaps.
Dashboard
- Dashboard: Toggle visibility on or off.
- Position: Adjust where the dashboard appears on the chart.
- Size: Set the display size of the dashboard for optimal readability.
Style
- Filled Bullish Gap: Toggle visibility and choose color.
- Filled Bearish Gap: Toggle visibility and choose color.
- Unfilled Gap: Toggle visibility and choose color.
- Max Deviation Level: Toggle and customize this visual level.
- Open Price Level: Toggle and customize the open price display.
FAQ
What is the Session Gap Fill trading indicator?
It’s a tool that detects price gaps between regular trading sessions, helping traders visualize unfilled and filled gaps and analyze how markets behave around them.
How does this indicator improve trading strategies?
By understanding how gaps tend to fill, traders can identify short-term reversal or continuation setups and refine entries around session opens and closes.
Can I filter specific gap types?
Yes, the Gap Type Filter lets you choose between all, overlapping, or non-overlapping gaps, depending on your trading style and strategy.
Where can I get access to the Session Gap Fill indicator?
You can get access on the LuxAlgo Library for charting platforms like TradingView, MetaTrader (MT4/MT5), and NinjaTrader for free.
Trading & investing are risky and many will lose money in connection with trading and investing activities. All content on this site is not intended to, and should not be, construed as financial advice. Decisions to buy, sell, hold or trade in securities, commodities and other investments involve risk and are best made based on the advice of qualified financial professionals. Past performance does not guarantee future results.
Hypothetical or Simulated performance results have certain limitations. Unlike an actual performance record, simulated results do not represent actual trading. Also, since the trades have not been executed, the results may have under-or-over compensated for the impact, if any, of certain market factors, including, but not limited to, lack of liquidity. Simulated trading programs in general are designed with the benefit of hindsight, and are based on historical information. No representation is being made that any account will or is likely to achieve profit or losses similar to those shown.
Testimonials appearing on this website may not be representative of other clients or customers and is not a guarantee of future performance or success.
As a provider of technical analysis tools and strategies, we do not have access to the personal trading accounts or brokerage statements of our customers. As a result, we have no reason to believe our customers perform better or worse than traders as a whole based on any content, tool, or platform feature we provide.
Charts used on this site are by TradingView in which the majority of our technical indicators are built on. TradingView® is a registered trademark of TradingView, Inc. www.TradingView.comTradingView® has no affiliation with the owner, developer, or provider of the Services described herein.
Market data is provided by CBOE, CME Group, BarChart, CoinAPI. CBOE BZX real-time US equities data is licensed from CBOE and provided through BarChart. Real-time futures data is licensed from CME Group and provided through BarChart. Select cryptocurrency data, including major coins, is provided through CoinAPI. All data is provided “as is” and should be verified independently for trading purposes.
This does not represent our full Disclaimer. Please read our full disclaimer.
© 2026 LuxAlgo Global, LLC.