Smart Money Index
 By LuxAlgoMar 4, 2026
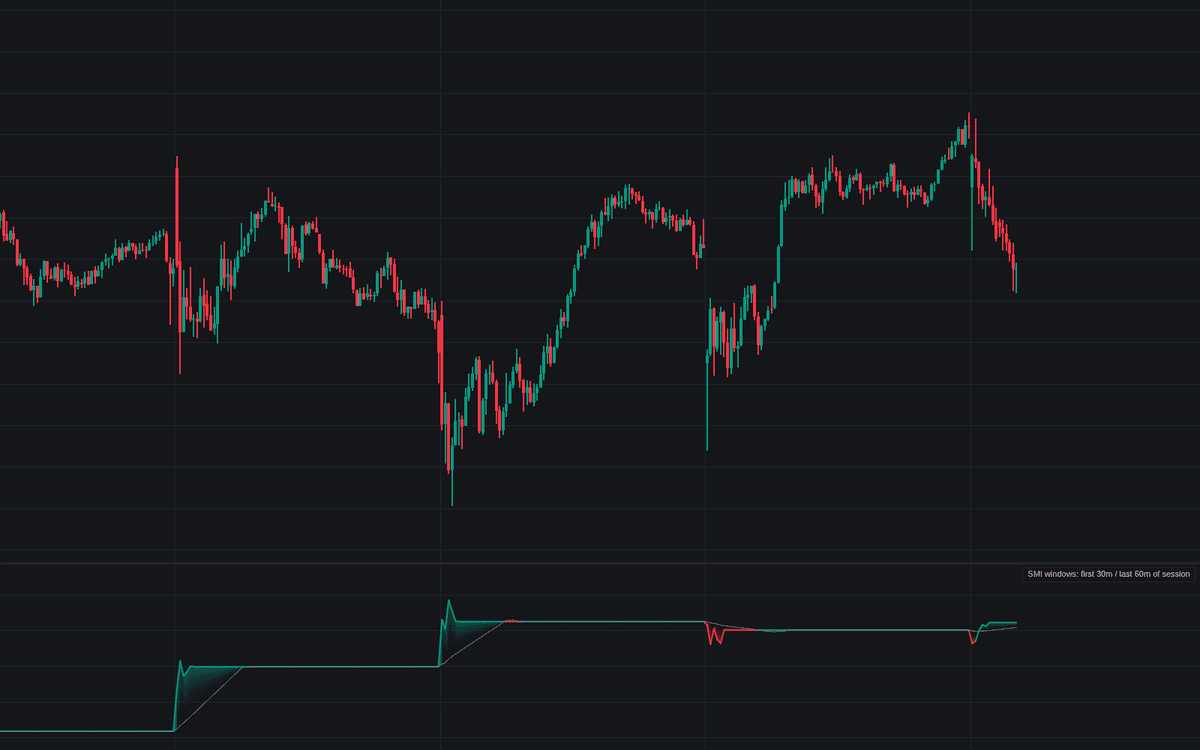

Smart Money Index maintains the running total behind the session-anatomy read, the definitive clean build of the Smart Money Index with its windows exposed as inputs. On intraday charts the opening window's net change is subtracted and the closing window's added, scaled by their weights; on daily and higher charts a fallback subtracts the overnight gap and adds the open-to-close move, a mode readout stating which calculation is active.
How to Trade the Smart Money Index?
- Direction over level: the absolute value means little; an SMI grinding higher under a flat tape records persistent late-session firmness.
- Bearish divergence: price sets a higher high the SMI declines to confirm, the distribution-into-strength read.
- Bullish divergence: price dips to a lower low while the SMI's low holds higher, accumulation under a weak tape.
- MA crosses: the SMI crossing its moving average recolors the line and fires alerts, a faster trigger on a slow line.
Divergences are context, not triggers, and can build for weeks before mattering.
Smart Money Index Settings
- Opening Window (default 30) and its Weight (default 1.0): minutes after the open treated as emotional flow and subtracted; 1 reproduces the classic formula.
- Closing Window (default 60) and its Weight (default 1.0): minutes before the close treated as deliberate flow and added. Use a chart timeframe dividing the windows evenly: 30m or lower for the defaults.
- Show Moving Average (default on), Type (default SMA), Length (default 20): the smoothing the line is judged against.
- Show Divergences (default on), Pivot Length (default 5), Max Bars Between Pivots (default 60): swing confirmation and the maximum span between compared swings.
- Gradient Fill (default on) and Show Calculation Mode (default on): presentation and the fallback readout.
Frequently Asked Questions

Original indicatorBuilt in-house by LuxAlgo
The Library is free. Quant makes it yours.
Pull any concept or indicator into Quant: rebuild it, retune it, or turn it into a backtested strategy of your own.