Concept
Smart Money Index
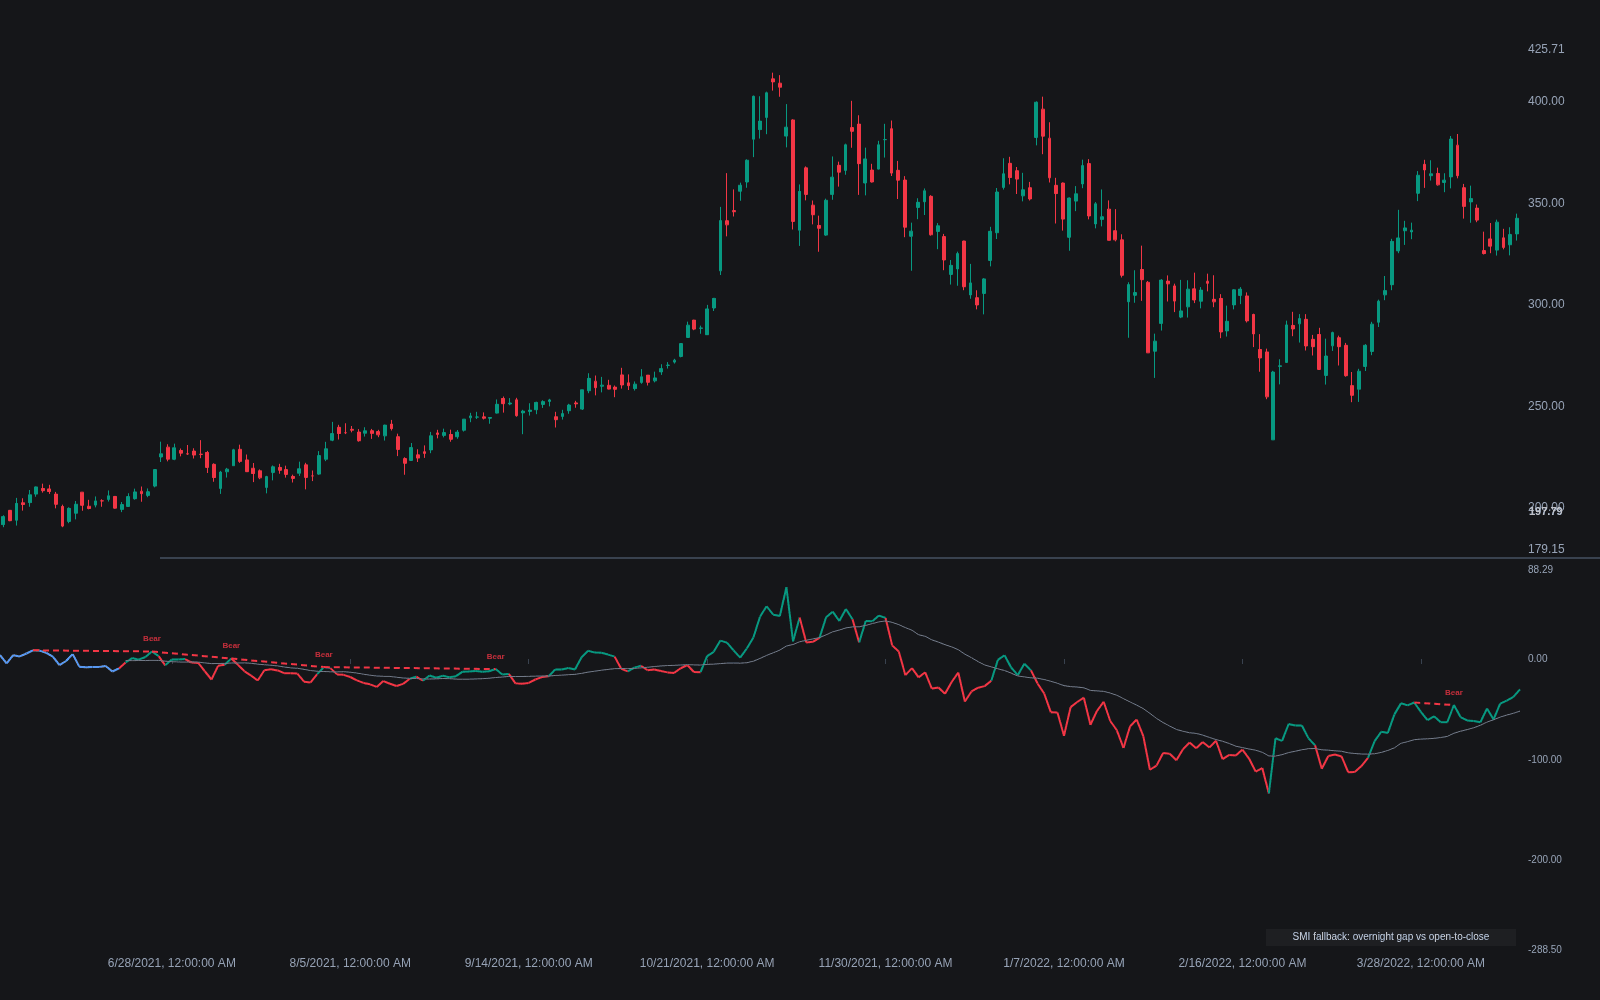
Smart Money Index is a Volume & Order Flow concept. The Library holds 1 implementation, a working definition you can pull into Quant.
SMI
Top Smart Money Index indicator
The top custom implementation, built on the original standard Smart Money Index formula.
1 total
This Smart Money Index implementation is strategy-ready: open it in Quant, set your rules, and it backtests automatically.
What is the Smart Money Index?
The Smart Money Index (SMI) is a cumulative sentiment line for stock indexes, usually credited to money manager Don Hays. It rests on a premise about intraday time-of-day effects: the first half hour of the cash session is dominated by emotional, news-driven trading, while the final hour is where more deliberate, well-capitalized participants position. Each day the running total subtracts the index's net change over the first 30 minutes and adds the net change over the last hour.
A market that habitually sells off early and firms late therefore builds a rising SMI even if closing prices go nowhere. The absolute level means little; practitioners track its direction and its divergences from the underlying index. New index highs the SMI refuses to confirm are read as distribution into strength, and SMI resilience under a falling tape as accumulation. Like OBV and other cumulative lines it is slow and contextual, and it depends on a defined session open and close, which is why it is applied to cash-session index data rather than 24-hour markets.
The behavioral premise has real anatomy behind it. The open concentrates overnight news reactions and relative volume spikes from orders queued while the market was closed, while the close concentrates institutional execution: benchmark-tracking flows, index rebalancing and market-on-close auctions all cram deliberate size into the final hour. The SMI formalizes that asymmetry into one line. Variants circulate under names like the Smart Money Flow Index with different window lengths and weightings, which is why published series from different sources track each other loosely but rarely match.
Two modern caveats keep the tool honest. First, the close's information content has shifted: closing auctions are now dominated by passive and mechanical flows, which are deliberate but not directional bets, so late-session strength reads less purely as informed accumulation than it did when the concept was coined. Second, around-the-clock futures blur the open, since much of the overnight news is priced before the cash bell. Modern reinterpretations, like AlgoAlpha's volume-weighted Smart Money Volume Index, rework the premise with participation data, and most practitioners have downgraded the SMI from oracle to context: one line describing session anatomy, weighed alongside breadth.
How to identify Smart Money Index readings
The construction is one subtraction and one addition a day; the reading discipline is where the craft lives.
- 1Use cash-session index data with a defined open and close; the calculation needs both anchors, which is why 24-hour products need synthetic sessions or exclusion.
- 2Each day, subtract the index's net change over the first 30 minutes and add the net change over the final hour to the running total.
- 3Pin down the variant: window lengths and weightings differ across sources, and comparisons only mean something within one formula.
- 4Plot the line against its index and read direction and divergence over multi-week windows, ignoring the absolute level entirely.
- 5Demand confirmation: a divergence becomes actionable when breadth, volume, and eventually price agree, not on its own schedule.
How it's calculated
A cumulative line that subtracts each session's emotional first 30 minutes and adds the final hour, where informed flow is assumed to trade.
Popularized by money manager Don Hays and classically computed on the Dow Jones Industrial Average; Lynn Elgert described a similar gauge in Barron's in 1988.
The absolute level is meaningless because it depends on the seed; only the slope and divergences from price are read.
Variants use the first 60 minutes instead of 30, or weight the two windows differently.
How traders use it
- As a divergence study: multi-week disagreement between the SMI and its index is the classic read, flagging distribution beneath a strong tape or accumulation beneath a weak one. Divergences can persist for months before mattering, so they are context, not triggers.
- As trend confirmation: an index advance accompanied by a same-direction SMI is treated as better supported than one where late-session flows consistently lean the other way.
- As one input among internals: the premise that informed money trades late is an assumption rather than a law, so most users weigh the SMI alongside breadth and volume measures instead of acting on it alone.
- Beside faster money-flow reads: pairing the slow SMI line with bounded short-window tools like the Money Flow Index separates regime-scale session behavior from swing-scale pressure, two questions one line cannot answer alone.
- As session-anatomy context: the same open-versus-close asymmetry the SMI accumulates can be cross-checked bar by bar against where price closes relative to the session VWAP, late-session strength above the session's average price being the intraday version of the SMI's daily addition.
Smart Money Index vs related cumulative reads
OBV: OBV accumulates each day's full volume signed by the close's direction; the SMI ignores volume entirely and accumulates two time slices of price change. Both are unbounded lines read through divergence, but one measures participation, the other measures when in the day the buying happens.
Money Flow Index: MFI is a bounded 0-100 oscillator over a short window, built for overbought and oversold timing. The SMI is an unbounded cumulative line whose message emerges over weeks. They operate on different clocks and answer different questions, which is precisely why they pair without redundancy.
Session VWAP: Session VWAP benchmarks every trade against the day's average price, an execution-quality lens on the same institutional behavior the SMI tries to capture. VWAP answers where the day's business cleared; the SMI answers whether the close keeps outrunning the open across many days.
Concept family
Volume & Order Flow
88 concepts mapped · 88 in the Library
Smart Money Index FAQ
Turn Smart Money Index into a trading strategy.
Take the implementation from this page into Quant, then build on it, backtest it on real data, and keep refining it in conversation.