Stop-and-reverse
 By LuxAlgoJun 15, 2026
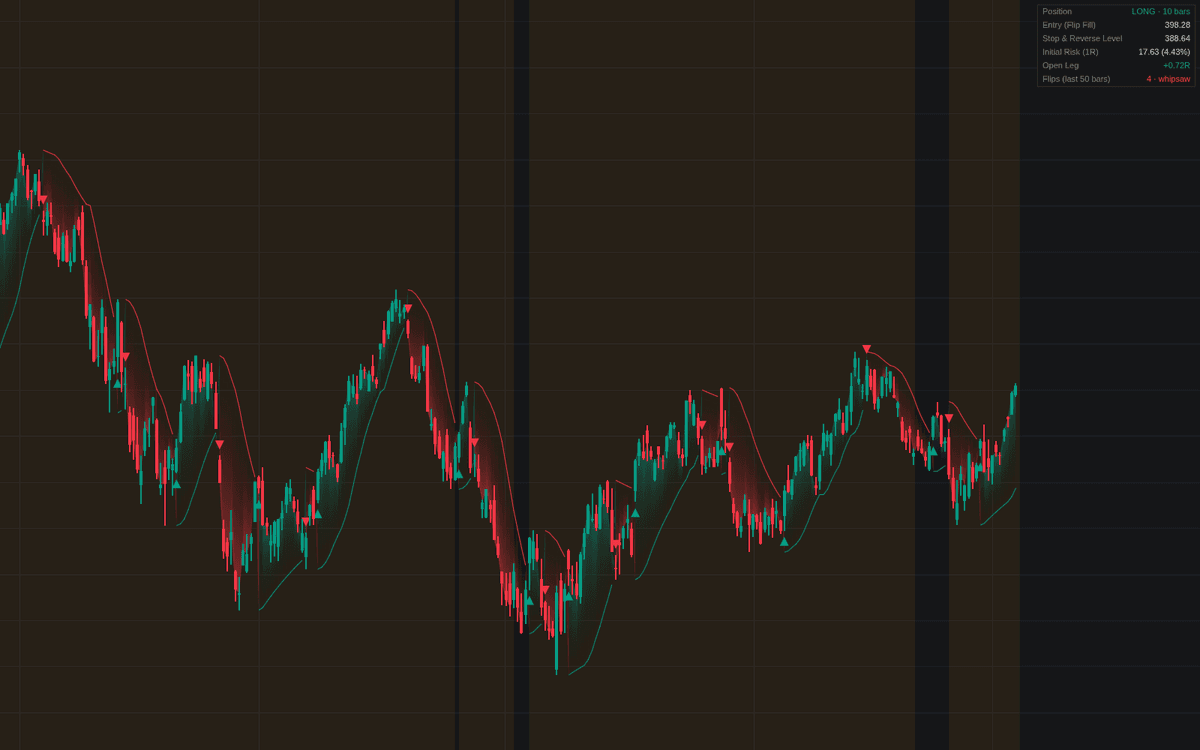

Stop-and-reverse implements the stop-and-reverse exit style at its purest: the same touch that stops one leg fills the entry of the next. A parabolic level trails the open leg, accelerating toward price as the trend extends, so the system is never flat. A dashboard reports the current side and age, flip fill price, level in force, initial risk (1R), open R-multiple and the flip count inside a rolling window.
How to Trade the Stop-and-reverse?
- Flip to Long: the short leg is stopped and the level resets below price, ratcheting upward from there.
- Flip to Short: the mirrored event, with the level resetting above price and descending only.
- Whipsaw Highlight: the background shades while flips cluster: ranging tape where reversals are often demoted to alerts pending separate confirmation.
The gradient fill spans the flip distance, the risk on every leg. Because each reversal order both exits and enters, every flip executes double size, worth remembering in thin markets. It sits among the risk and exit tools as the archetypal always-in construction.
Stop-and-reverse Settings
- Acceleration Start (default 0.02): starting acceleration factor of the trailing level.
- Acceleration Step (default 0.02): added at each new extreme. Larger steps tighten the trail faster.
- Acceleration Maximum (default 0.2): the factor's ceiling; higher values hug price sooner but flip more in chop.
- Flip Count Window (default 50): recent bars over which flips are counted.
- Whipsaw Threshold (default 4): flip count that flags a whipsaw cluster.
- Dashboard and style toggles cover the position panel, line-versus-dots display, trail fill, flip markers and whipsaw highlight.
Frequently Asked Questions

The Library is free. Quant makes it yours.
Pull any concept or indicator into Quant: rebuild it, retune it, or turn it into a backtested strategy of your own.