Concept
Stop-and-reverse
Stop-and-reverse is a Risk, Sizing & Exits concept. The Library holds 1 implementation, a working definition you can pull into Quant.
SAR
Top Stop-and-reverse indicator
The top custom implementation, built on the original standard Stop-and-reverse formula.
1 total
This Stop-and-reverse implementation is strategy-ready: open it in Quant, set your rules, and it backtests automatically.
What is Stop-and-reverse?
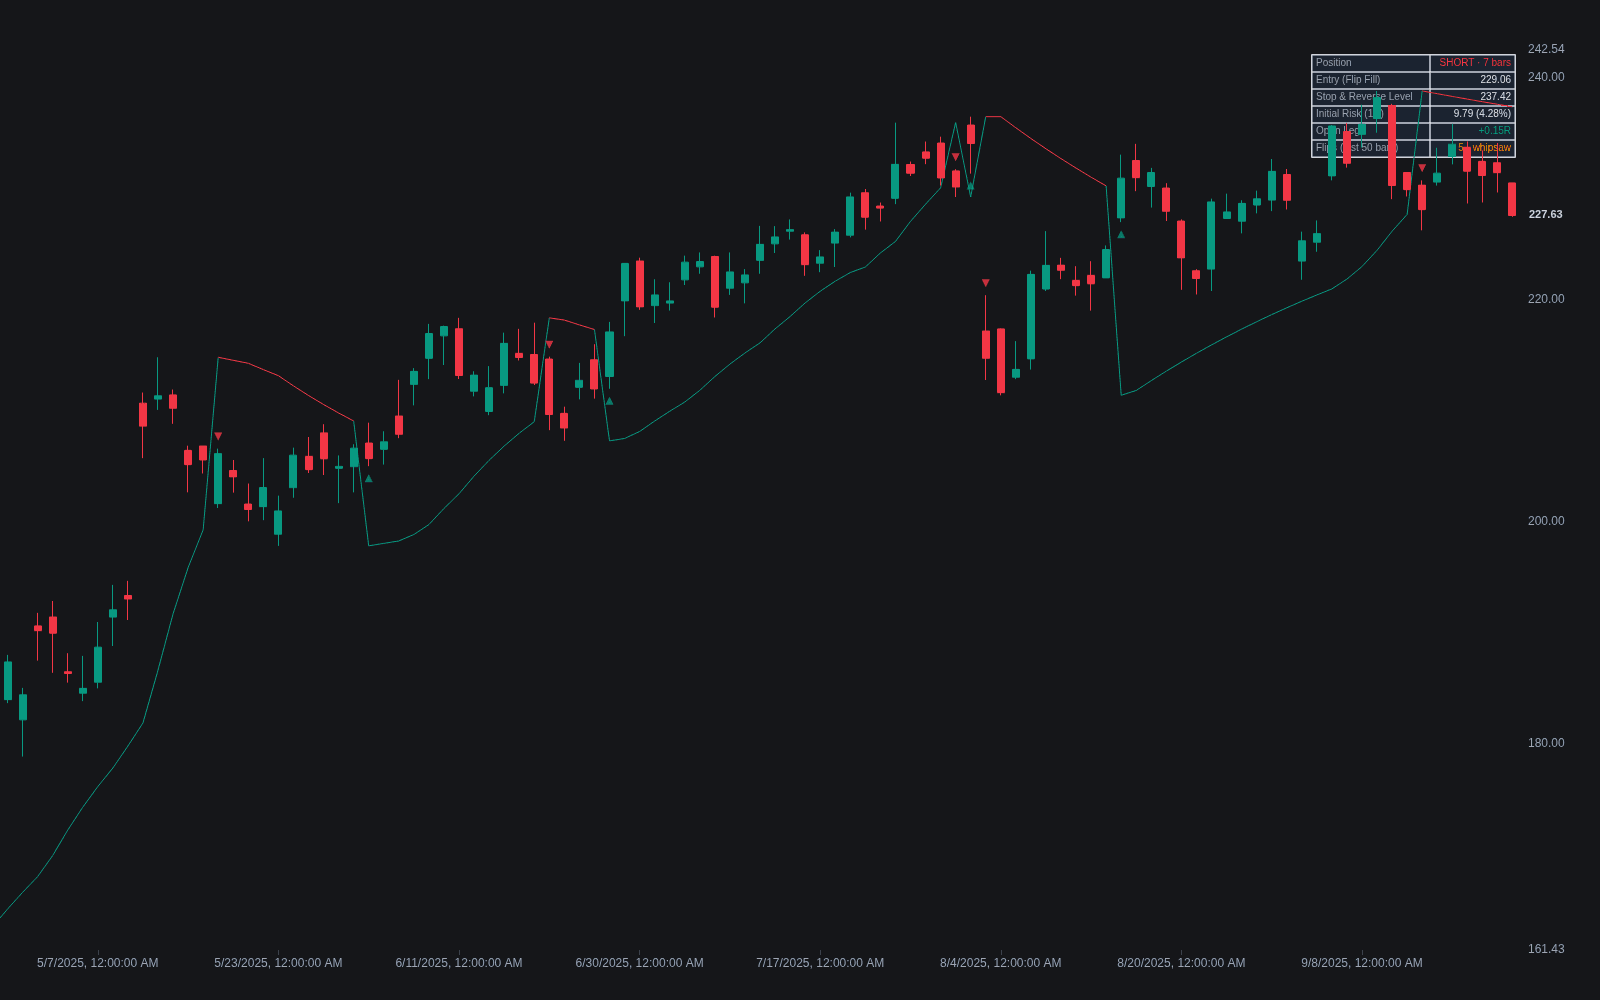
Stop-and-reverse (SAR) is an exit style in which the stop is also the next entry: when price hits the level that invalidates a long, the system closes the long and opens a short in the same act, and vice versa. A pure stop-and-reverse system is therefore always in the market, alternating long and short with no flat state. The idea is baked into several classic tools: Wilder's Parabolic SAR is named for it, moving average crossovers reverse at every cross by construction, and flip-style trailing overlays such as Supertrend, one branch of the trailing method taxonomy, mark a reversal point each time price crosses the trailing band.
The lineage runs through early mechanical trend following, where systems that flipped position on the opposite signal were a staple of mid-twentieth-century channel and breakout research. The acronym spread through J. Welles Wilder's New Concepts in Technical Trading Systems (1978), whose Parabolic Time/Price system trails a level that accelerates toward price and reverses the position when touched. The appeal was mechanical purity: one rule set defines both sides of the market, with no separate exit logic to tune. Many chartists have since gone the other way, plotting the parabolic dots purely as a trailing exit and never taking the reverse trade.
The always-in property is the whole trade-off. In persistently trending markets it means the system cannot miss the turn: the losing side closes exactly when the winning side begins. In choppy regimes it roughly doubles the cost of every whipsaw, since each false flip books a loss and immediately exposes the account in the new, equally wrong direction. That is why many modern implementations demote the reversal side to an alert or exit-only signal, gating actual reversals behind a regime filter.
Reversal mechanics also reshape risk arithmetic. A flip closes one position and opens the opposite one, so the executed size at the reversal is double the position size, which matters for slippage in thin markets and for how the flip is expressed in order constructs. The flip distance is the risk on every leg, so disciplined implementations define it in R-multiple terms and cap runaway whipsaw sequences with loss-control rules such as daily stop-out limits.
How to identify stop-and-reverse behavior on a chart
Stop-and-reverse is a property of a system or overlay rather than a price pattern, but it is easy to spot once plotted.
- 1Apply a flip-style overlay (Parabolic SAR dots, a Supertrend-like band, or crossover markers): it sits below price when bullish and above price when bearish.
- 2Locate the flips, bars where the marker jumps to the other side of price; each flip is simultaneously an exit and an opposite entry.
- 3Confirm there are no flat periods: each position ends exactly where the next begins, alternating long and short without gaps.
- 4Count flips inside the most recent congestion zone; tight alternation there is the signature whipsaw cost of always-in logic in ranging tape.
How traders use it
- As the skeleton of always-in trend systems: channel-breakout and crossover strategies that reverse on the opposite signal, accepting whipsaw costs in exchange for never sitting out a major trend leg.
- As exit-plus-alert logic: the reversal level closes the position, while the would-be reverse entry is downgraded to an alert that requires separate confirmation, such as a higher-timeframe trend filter, before real size goes on.
- As a benchmark in system design: running a strategy's exit logic, a structure stop trail for instance, against a simple stop-and-reverse variant on the same entries shows whether the added exit complexity actually earns its keep versus always-in behavior.
- As a sizing discipline: the flip distance defines each leg's risk, so position size is back-solved with fixed fractional rules rather than chosen first, keeping every alternation's loss a constant fraction of equity.
Stop-and-reverse vs related exit logic
Trailing Method Taxonomy: The taxonomy catalogues the ways a stop can follow price: swing-based, volatility-based, parabolic, profit-locking. Stop-and-reverse is the aggressive end of that family: where other trailing methods exit to flat when hit, the SAR trail doubles as the next entry.
Volatility Stop: A volatility stop trails at an ATR multiple, the chandelier variant hanging it from the highest high of the move, and exits to flat when touched. It becomes stop-and-reverse the moment the rules take the opposite trade at the touch; the distance logic is identical, the difference is whether a flat state exists.
Concept family
Risk, Sizing & Exits
37 concepts mapped · 37 in the Library
Stop-and-reverse FAQ
Turn Stop-and-reverse into a trading strategy.
Take the implementation from this page into Quant, then build on it, backtest it on real data, and keep refining it in conversation.