


SuperTrend Recovery
Feb 17, 2026
The SuperTrend Recovery indicator is an advanced trend-following trading indicator that enhances the classic SuperTrend strategy with a dynamic recovery mechanism. Designed for volatile markets such as crypto, indices, and high-beta equities, this adaptive SuperTrend helps traders manage pullbacks more efficiently by tightening the trailing stop during deep retracements—without prematurely triggering a full trend reversal. The result is a more responsive trend trading strategy that aims to reduce drawdown while preserving directional bias.
How to Trade the SuperTrend Recovery Indicator
Like the traditional SuperTrend trading indicator, the SuperTrend Recovery can be used to identify market direction, define trailing stop-loss levels, and structure systematic trading strategies. However, its recovery logic introduces a volatility-aware layer that makes it particularly useful in fast-moving or whipsaw conditions.
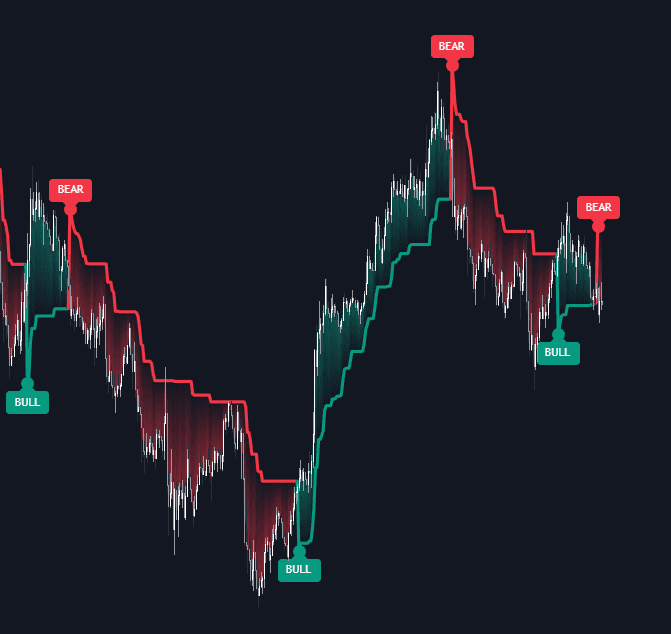
Trend Detection and Market Bias
The indicator visually defines the prevailing trend using dynamic ATR-based bands:
- When price is trading above the band, the market is in a BULL trend.
- When price is trading below the band, the market is in a BEAR trend.
- Trend reversals are clearly marked with "BULL" or "BEAR" labels and a colored circle at the exact switch point.
This structure makes the SuperTrend Recovery suitable for:
- Trend-following strategies
- Trailing stop-loss management
- Position bias filtering
- Systematic trading model integration
Traders can use the band as a dynamic stop level, exiting long trades when price closes below the band in a bull trend, or exiting short trades when price closes above the band in a bear trend.
Adaptive Recovery Mechanism for Volatile Markets
Where this trading indicator truly differentiates itself from the standard SuperTrend is in its Recovery Mechanism.
In a classic SuperTrend, the band remains static if price pulls back but does not fully reverse. This can sometimes lead to large drawdowns before a stop is triggered.
The SuperTrend Recovery improves upon this by introducing adaptive tightening:
- If price moves significantly against the active trend,
- And the deviation exceeds a predefined threshold,
- The band begins to adjust toward price using an exponential smoothing formula.
This makes the trailing stop progressively tighter during deep pullbacks—potentially securing profits earlier if the recovery attempt fails.
This feature is especially valuable for:
- High-volatility trading environments
- Crypto trading strategies
- Short-term swing trading
- Risk-managed trend systems
Indicator Logic Explained
The SuperTrend Recovery is built on a two-stage calculation framework:
Base SuperTrend Logic
The foundation remains the traditional SuperTrend formula:
- ATR (Average True Range) is calculated over a user-defined period.
- A multiplier determines the distance of the band from price.
- During a bull trend, the band can only move upward.
- During a bear trend, the band can only move downward.
This ensures the indicator preserves classic trend-following behavior under normal market conditions.
Recovery Logic: Dynamic Stop Tightening
The recovery logic activates when price enters a drawdown relative to the Switch Price (the price at which the current trend began).
If the deviation exceeds the Recovery Threshold, the band transitions into a smoothing mode:
targetBand = alpha * close + (1.0 - alpha) * prevBand
Where:
alphais the Recovery Alphacloseis the current priceprevBandis the previous band value
This creates a tapering effect:
- The band accelerates toward price.
- The trailing stop tightens progressively.
- Risk exposure is reduced during failed trend continuations.
Unlike a full trend reversal, this mechanism allows the strategy to adapt without immediately flipping bias—offering a more nuanced risk control model compared to standard SuperTrend implementations.
SuperTrend Recovery Settings Explained
The indicator includes customizable parameters to suit different trading styles and asset classes.
SuperTrend Core Settings
- ATR Length: Controls the volatility lookback period. Lower values increase responsiveness; higher values smooth the band.
- Base Multiplier: Determines the baseline distance between price and the band. Larger multipliers reduce noise but increase stop distance.
These two inputs define the core structure of the trend-following system.
Recovery Logic Parameters
-
Recovery Alpha (%): Controls how aggressively the band adjusts during recovery mode.
- Higher values = faster tightening
- Lower values = smoother adjustment
-
Recovery Threshold (xATR): Defines how far price must move against the trend (in ATR units) before recovery logic activates.
This separation between trend logic and recovery logic allows traders to fine-tune the indicator for:
- Scalping strategies
- Swing trading systems
- Systematic portfolio models
- Volatility-adaptive trading strategies
Visualization Options
To enhance chart readability and strategy integration:
- Show Gradient Fills: Displays a background gradient between price and the SuperTrend band for clear trend visualization.
- Show Signal Labels: Toggles BULL/BEAR labels at reversal points.
These visual features make the indicator suitable for both discretionary traders and algorithmic system designers.
Why Use SuperTrend Recovery Instead of Standard SuperTrend?
While the classic SuperTrend remains a popular trading indicator, it can lag in volatile pullbacks. The SuperTrend Recovery introduces:
- Adaptive trailing stop logic
- Volatility-based tightening
- Reduced drawdown exposure
- Improved risk management structure
For traders operating in markets with frequent liquidity sweeps and aggressive retracements, this recovery-enhanced SuperTrend can provide a significant structural advantage.
FAQ
What is the SuperTrend Recovery indicator?
It is an advanced SuperTrend-based trading indicator that incorporates a dynamic recovery mechanism to tighten trailing stops during deep pullbacks without immediately reversing the trend.
Is this indicator suitable for all markets?
Yes. The SuperTrend Recovery can be used on stocks, forex, crypto, futures, and indices. It is particularly effective in volatile markets where standard trailing stops may lag.
How does the Recovery Alpha affect the strategy?
Recovery Alpha controls how quickly the trailing band adjusts toward price during recovery mode. Higher values result in faster tightening and earlier exits.
How do I access the SuperTrend Recovery indicator?
You can get access on the LuxAlgo Library for charting platforms like TradingView, MetaTrader (MT4/MT5), and NinjaTrader for free.
Trading & investing are risky and many will lose money in connection with trading and investing activities. All content on this site is not intended to, and should not be, construed as financial advice. Decisions to buy, sell, hold or trade in securities, commodities and other investments involve risk and are best made based on the advice of qualified financial professionals. Past performance does not guarantee future results.
Hypothetical or Simulated performance results have certain limitations. Unlike an actual performance record, simulated results do not represent actual trading. Also, since the trades have not been executed, the results may have under-or-over compensated for the impact, if any, of certain market factors, including, but not limited to, lack of liquidity. Simulated trading programs in general are designed with the benefit of hindsight, and are based on historical information. No representation is being made that any account will or is likely to achieve profit or losses similar to those shown.
Testimonials appearing on this website may not be representative of other clients or customers and is not a guarantee of future performance or success.
As a provider of technical analysis tools and strategies, we do not have access to the personal trading accounts or brokerage statements of our customers. As a result, we have no reason to believe our customers perform better or worse than traders as a whole based on any content, tool, or platform feature we provide.
Charts used on this site are by TradingView in which the majority of our technical indicators are built on. TradingView® is a registered trademark of TradingView, Inc. www.TradingView.comTradingView® has no affiliation with the owner, developer, or provider of the Services described herein.
Market data is provided by CBOE, CME Group, BarChart, CoinAPI. CBOE BZX real-time US equities data is licensed from CBOE and provided through BarChart. Real-time futures data is licensed from CME Group and provided through BarChart. Select cryptocurrency data, including major coins, is provided through CoinAPI. All data is provided “as is” and should be verified independently for trading purposes.
This does not represent our full Disclaimer. Please read our full disclaimer.
© 2026 LuxAlgo Global, LLC.