Support & Resistance Zones Strength Classifier
![]() By LuxAlgoFeb 16, 2026
By LuxAlgoFeb 16, 2026
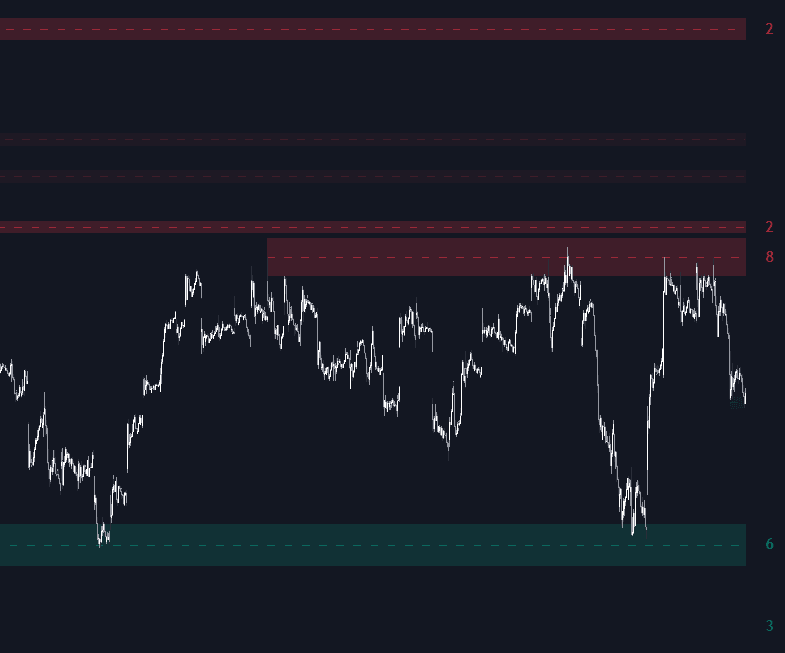
The Support & Resistance Zones Strength Classifier indicator is a professional trading indicator built to automatically detect, group, and rank key support and resistance levels based on real market reactions. By clustering pivot highs and lows into adaptive price zones and tracking how often they are tested, this tool transforms raw price structure into a dynamic support and resistance trading strategy that works across crypto, forex, stocks, and futures markets.
Unlike traditional support and resistance indicators that plot a single line for every pivot, this script consolidates nearby swing points into structured zones. These zones expand and adapt to volatility, highlight institutional reaction areas, and automatically remove broken levels — ensuring your chart stays clean, relevant, and focused on actionable price levels.
How to Trade the Support & Resistance Zones Strength Classifier Indicator?
This trading indicator identifies supply and demand zones by analyzing historical pivot highs and lows. When multiple pivots occur near the same price, they are grouped into a cohesive zone rather than plotted as separate lines. This creates a clearer, more strategic view of where the market repeatedly reacts.
Traders can use these zones for:
- Entry planning during pullbacks
- Stop loss placement beyond structural levels
- Breakout trading strategies
- Reversal confirmation at strong tested zones
- Trend continuation setups after successful retests
Because zones are built from confirmed pivots, they represent validated structure rather than speculative projections.
Zone Strength Classification for Smarter Trading Decisions
One of the most powerful aspects of this trading strategy tool is its strength scoring system.
Every time price revisits a zone and respects it (without closing through it), the zone’s test count increases. This allows traders to differentiate between newly formed levels and well-established institutional areas.
-
Weak / New Zones
- Higher transparency
- Fewer historical reactions
- Potential early-stage support or resistance
-
Strong / Highly Tested Zones
- Higher opacity
- Clear test-count label (optional)
- Proven reaction zones with multiple confirmations
The more times price respects a level, the more significant it becomes. This mirrors how professional traders evaluate liquidity pools and structural price memory.
Dynamic Zone Management for Clean Charts
This indicator actively manages support and resistance zones in real time to maintain chart clarity and structural accuracy.
Automatic Zone Merging
When two zones overlap, they are merged into a single consolidated zone. Their test counts are combined, strengthening the level. This prevents visual clutter and better reflects how markets treat nearby liquidity levels as a single reaction area.
Breakout Detection & Zone Removal
If a candle closes beyond a zone boundary:
- A resistance zone broken to the upside is removed.
- A support zone broken to the downside is removed.
This ensures that only active, respected zones remain visible.
Role Reversal Concept
While this script focuses on active zones:
- Broken resistance often becomes future support.
- Broken support can act as future resistance.
Traders can incorporate this behavior into breakout and retest trading strategies.
Volatility-Adjusted Zone Construction
This support and resistance indicator adapts to different asset classes by calculating zone thickness using a volatility-adjusted distance based on average bar range.
This means:
- High-volatility markets like BTC or NASDAQ futures produce proportionally wider zones.
- Lower-volatility assets like stablecoins or blue-chip stocks produce tighter zones.
This dynamic sizing prevents zones from being too narrow in fast markets or too wide in slow ones, making the indicator suitable for intraday trading, swing trading, and position trading.
Sensitivity Control with Pivot Lookback
The Pivot Lookback parameter determines how sensitive the indicator is to swing detection.
- Higher values:
- Capture major structural highs and lows
- Ideal for swing trading and higher timeframes
- Lower values:
- Capture smaller, more frequent pivots
- Useful for scalping and lower timeframes
This flexibility allows traders to tailor the trading indicator to their strategy and timeframe.
SETTINGS
Calculation Settings
- Pivot Lookback: Number of bars required on both sides of a pivot to confirm it.
- Zone Width (dist Multiplier): Controls vertical thickness of zones using average bar range.
- Minimum Tests to Highlight: Number of reactions required before a zone is visually emphasized.
- Max Active Zones Per Type: Limits total support and resistance zones to reduce clutter.
- Max Zone Height (dist Multiplier): Deletes excessively wide zones caused by over-merging.
These settings allow precise optimization for different markets and volatility environments.
Visual Customization
- Support / Resistance Colors: Fully customizable bullish and bearish zone colors.
- Show Test Count Labels: Displays the number of successful reactions per zone.
- Extend Zones to Right: Projects zones forward to the current bar for active trade planning.
This makes the indicator adaptable to both minimalist and information-rich chart layouts.
Why Use a Zone-Based Support & Resistance Trading Indicator?
Traditional horizontal line methods often oversimplify market structure. Markets react to areas, not single price ticks. By grouping pivots into dynamic zones and ranking them by strength, this tool provides:
- Objective structural analysis
- Institutional-style level clustering
- Automatic breakout invalidation
- Adaptive volatility scaling
- Clean chart management
Whether you trade reversals, breakouts, liquidity sweeps, or pullback continuations, this indicator enhances price action trading with quantified structure.
Frequently Asked Questions
What makes this support and resistance indicator different from standard pivot tools?
Instead of plotting isolated pivot lines, it clusters nearby pivots into zones and ranks them by strength based on test frequency. This provides a more realistic representation of supply and demand.
Can this indicator be used for breakout trading strategies?
Yes. When a strong zone is broken with a confirmed close, traders can use the breakout for continuation setups or wait for a retest of the broken level.
Is this indicator suitable for all markets?
Yes. Because zone thickness adapts to volatility, it works across crypto, forex, stocks, and futures on multiple timeframes.
How do I access the Support & Resistance Zones Strength Classifier indicator?
You can get access on the LuxAlgo Library for charting platforms like TradingView, MetaTrader (MT4/MT5), and NinjaTrader for free.
Free indicator
Get free access to this indicator on the platforms below.
Unlock the entire LuxAlgo Library
Every indicator, every strategy, full charts, and complete access to Quant — our AI agent.