SVE Bands
 By LuxAlgoFeb 22, 2026
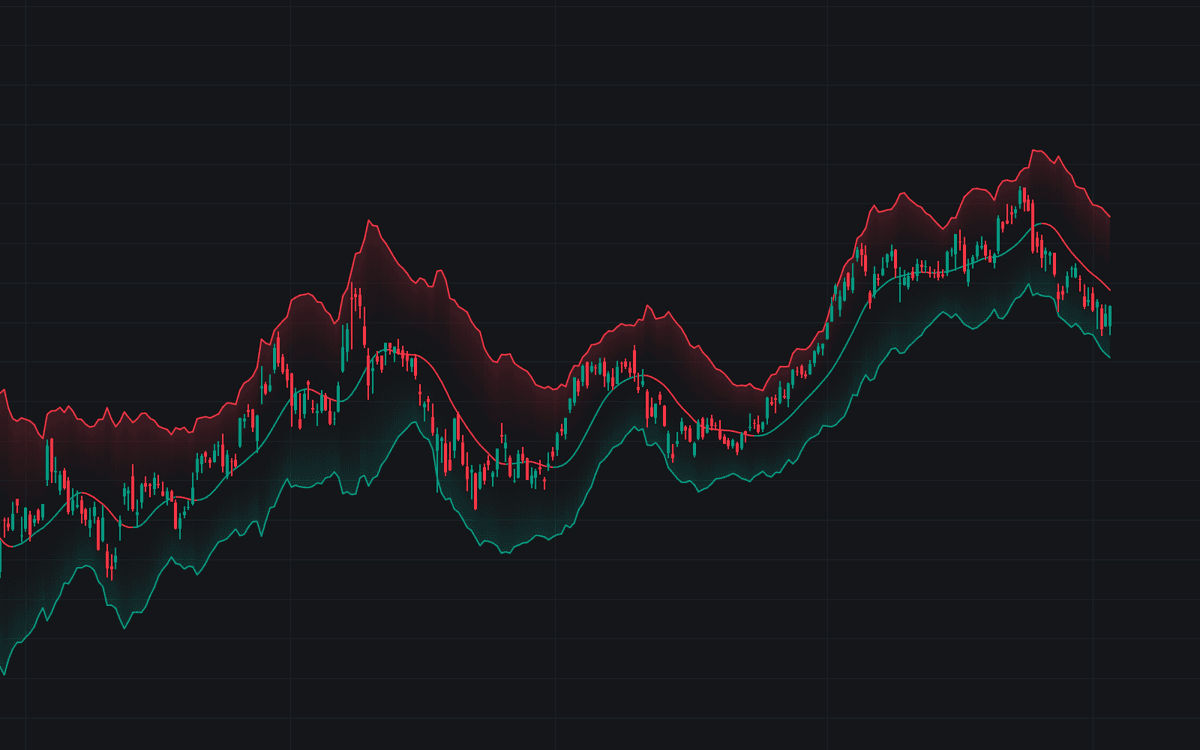

SVE Bands builds Sylvain Vervoort's SVE bands, an envelope that denoises its input before any band math runs. Typical price (optionally rebuilt from Heikin-Ashi-style averaged candles) is exponentially smoothed and averaged again, and the bands offset the double-smoothed base by an exponentially averaged, range-flavored deviation measure, so a single erratic bar barely deflects the pair.
How to Trade the SVE Bands?
- Close beyond a band: a stretch past the smoothed envelope. Fewer print than raw-band tags, each meaning more.
- Close back inside a band: the calmer mean-reversion trigger this construction is built for, aiming back at the centerline as its natural target.
- Centerline slope: the line tints with its direction, a low-flicker bias read, since the heavily smoothed center rounds through turns instead of jittering.
Band Width plots to the data window: narrowing marks compression, widening release. Alerts cover excursions, reversions, centerline crosses and slope turns, a natural fit beside the rest of the volatility toolkit.
SVE Bands Settings
- Input Series (default Typical Price): raw typical price, or Heikin-Ashi Typical to blend each candle with its neighbors first.
- Smoothing Length (default 8): length of the exponential smoothing and of the second average run on it. The double pass is the signature.
- Volatility Length (default 13): lookback of the average on the deviation measure.
- Deviation Multiplier (default 3.55): averaged deviation units the upper band sits above center.
- Lower Band Adjust (default 0.9): fraction of the upper offset used below; set 1 for symmetry.
- Style toggles cover slope coloring (on), the band gradient fill (on) and reversion markers (off).
Frequently Asked Questions

Original indicatorBuilt in-house by LuxAlgo
The Library is free. Quant makes it yours.
Pull any concept or indicator into Quant: rebuild it, retune it, or turn it into a backtested strategy of your own.