Concept
SVE Bands
SVE Bands, also known as smoothed Heikin-Ashi bands, are Volatility concepts. The Library holds 1 implementation, a working definition you can pull into Quant.
Vervoort
Top SVE Bands indicator
The top custom implementation, built on the original standard SVE Bands formula.
1 total
From studying SVE Bands to trading it: take the implementation below into Quant and backtest it instantly.
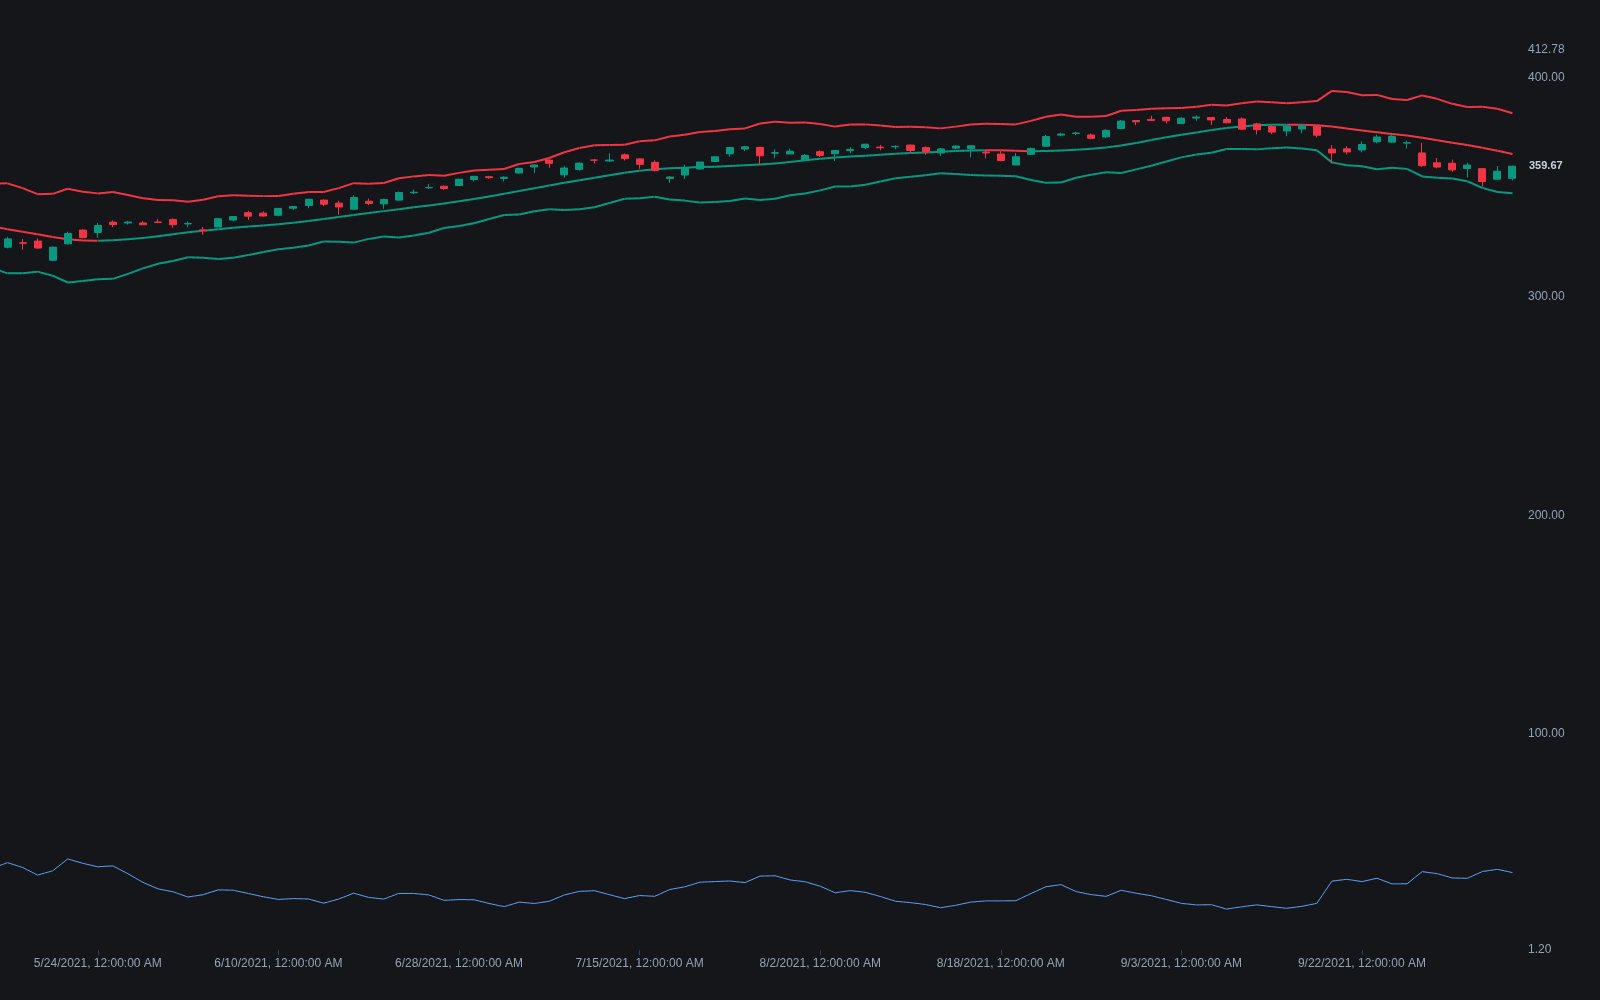
What are SVE Bands?
SVE bands are volatility bands from Sylvain Vervoort, the technical analyst and author of Capturing Profit with Technical Analysis whose studies appeared under the SVE prefix in Technical Analysis of Stocks & Commodities magazine. The design idea is to denoise the input before drawing bands: rather than centering on a moving average of raw closes, the construction first smooths price, commonly through Heikin-Ashi-style averaged candles or exponential pre-smoothing, plus additional low-lag filtering, then offsets bands by a volatility measure around that smoothed center. Published variants differ in the exact smoothing chain and deviation measure.
The smoothing chain is the signature. Vervoort's studies lean on two recurring ingredients: candles recomputed Heikin-Ashi style, so each bar already averages in its neighbors, and zero-lag exponential techniques that add back an estimate of the delay smoothing introduces. His 2013 band study, Within The Volatility Band, centers the bands on an average of exponentially smoothed typical price and derives the offsets from typical-to-low price differences across adjacent bars, a range-flavored measure that still widens and narrows with realized volatility; an adjustment factor on the lower band answers Vervoort's observation that price reaches the upper band more often. The best-known charting implementation is the Vervoort Volatility Bands port published by LazyBear.
The intended effect is fewer noise-driven touches than raw Bollinger Bands produce: a single erratic bar barely moves a smoothed center, so an excursion to a band is more likely to reflect a genuine stretch. The cost is the usual one for smoothing: added lag, so band signals arrive later than their raw-price counterparts.
Within the band family the design occupies a distinct niche. Most alternatives vary the offset: standard deviation for Bollinger Bands, ATR for Keltner Channels and ATR Bands, fixed percentages for a simple envelope. SVE bands instead vary the input, leaving the envelope logic conventional but feeding it a cleaner series. That makes them less a new signal than a noise-management layer: familiar band readings carry over, arriving later and flickering less.
How to identify SVE Bands on a chart
SVE bands look like conventional volatility bands; the tell is how calmly they behave.
- 1Plot an SVE implementation (the Vervoort Volatility Bands port is the usual one) and study the center line: it rounds through turns without the bar-by-bar jitter of an equal-length average of closes.
- 2Overlay standard Bollinger Bands at a similar length: the SVE pair typically shows fewer band touches, and its width changes more gradually.
- 3Check a spike bar: a lone wide-range candle deflects raw bands immediately, while the smoothed pair barely reacts. That difference is the whole design.
- 4Then read them as usual: center slope for bias, price position between the bands for stretch, width for the volatility state.
How it's calculated
Volatility bands drawn around a doubly smoothed typical-price midline, offset by a smoothed, scaled average of a directional one-bar range measure.
This is Sylvain Vervoort's volatility band construction (Within The Volatility Band, TASC, August 2013); with a below 1 the lower band sits deliberately closer to the midline, matching his observation that price tags the upper band more often.
Midline and offset are each smoothed twice, the midline as an SMA of an EMA of typical price and the offset as an EMA of an SMA of R, so the bands react later but flicker less than raw-price bands.
A related Vervoort design, the source of the smoothed Heikin-Ashi alias, applies Bollinger-style banding to a zero-lag TEMA of modified Heikin-Ashi closes instead; published variants differ in the exact smoothing chain and deviation measure.
How traders use it
- As a calmer mean-reversion framework: excursions beyond the bands on the smoothed series filter one-bar spikes, at the price of later entries and exits.
- As trend context: the smoothed centerline's slope and price's position between the bands read like standard band analysis with less flicker.
- As a comparison layer: running SVE bands beside conventional bands shows which raw-price touches were noise, a quick form of signal hygiene.
- As a compression read: sustained narrowing marks the same coiling that a Bollinger Squeeze or volatility contraction pattern targets, with fewer head-fake pinches; checking width against a volatility percentile shows whether the quiet is historically extreme.
- As a trailing reference: the opposite band can serve as a slow exit line in trends, steadier than tight ATR trails but slower to protect gains when a move reverses sharply.
SVE Bands vs other volatility bands
Bollinger Bands: Bollinger Bands center on an average of raw closes and offset by their standard deviation, reacting to every bar. SVE bands run the same envelope idea on a heavily smoothed series, trading immediacy for fewer false touches. Each side of that trade costs something.
Keltner Channels: Keltner Channels smooth the offset, using ATR around an EMA, but still center on lightly processed price. SVE bands push smoothing into the input itself, so they run calmer still. Keltner sits between raw Bollinger reactivity and the fully denoised SVE approach.
ATR Bands: ATR bands wrap a volatility offset around price or a basic average and shine as stop-placement rails. SVE bands aim at cleaner mean-reversion and trend reads instead; their heavier lag makes them a poor fit for tight stop logic, where prompt tracking matters.
Concept family
Volatility
57 concepts mapped · 57 in the Library
SVE Bands FAQ
Turn SVE Bands into a trading strategy.
Take the implementation from this page into Quant, then build on it, backtest it on real data, and keep refining it in conversation.