Sweep Volume Index
By LuxAlgoFeb 19, 2026

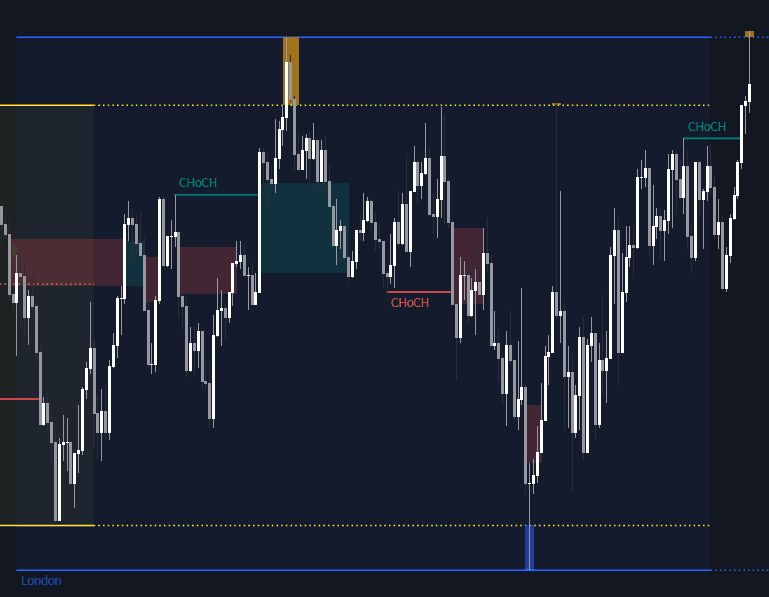
The Sweep Volume Index is a volume-based trading indicator built to reveal how much volume actually trades during liquidity sweeps at swing highs and swing lows. Instead of treating every breakout the same, it isolates the volume that occurs beyond key structural levels using intrabar data, helping traders judge whether a move is a real breakout, a stop-run, or a reversal trigger around high-liquidity zones.
Note: This trading indicator requires access to lower timeframe data. Ensure your chart has sufficient historical data for the intrabar timeframe selected.
How to Trade the Sweep Volume Index Trading Indicator?
The Sweep Volume Index helps traders analyze liquidity sweep volume to determine whether price pushing beyond a previous pivot is driven by aggressive participation (and potential absorption), or whether it clears the level with minimal resistance. This makes it useful for building a breakout filter, a reversal trading strategy, or a trend exhaustion framework across crypto, forex, stocks, and indices.
A practical way to use it is to treat the oscillator as an “intent meter” at structural levels:
- Big sweep volume = the market actively traded past the level (often stop orders getting triggered).
- Low sweep volume = price may have cleared the level with little opposition, sometimes enabling faster continuation.
- Repeated sweeps with changing price response = a strong clue about trend strength vs. trend exhaustion.
Identifying Reversals With Sweep Volume
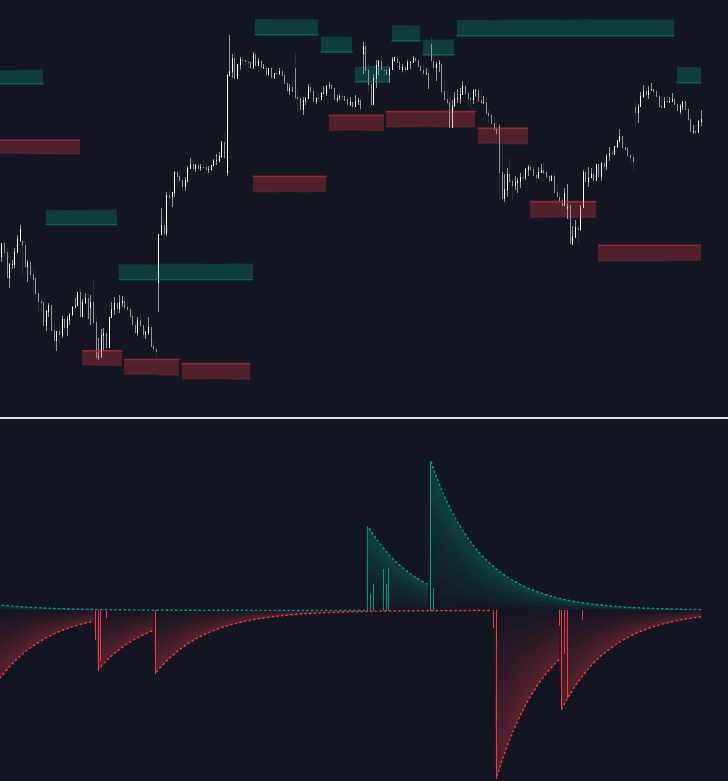
High sweep volume at an important swing level followed by clear price rejection can signal a high-probability reversal setup. When the oscillator prints a large spike as price pierces a pivot level but fails to close beyond it, it suggests liquidity was collected and absorbed—often aligning with the classic “fakeout” behavior traders associate with smart-money accumulation/distribution.
Common confirmation ideas traders pair with Sweep Volume Index signals:
- Rejection candle structure (long wick, weak close beyond the level)
- A shift in market structure after the sweep (lower high / higher low)
- Momentum divergence into the sweep zone
Trend Exhaustion and “Stop-Run Cycling”
Multiple sweeps appearing in succession with increasing sweep volume but decreasing price extension can point to trend exhaustion. This matters because trends often end not with a clean reversal candle, but with repeated attempts to run liquidity that fail to produce meaningful continuation.
The decaying envelopes in the oscillator pane help contextualize these spikes relative to recent historical sweep activity, making it easier to spot when “extraordinary” sweep volume is showing up repeatedly.
Liquidity Gaps and Fast Continuations
Low sweep volume at a pivot can imply price moved beyond the level without heavy participation, absorption, or resistance. In many markets, that can translate into a “liquidity gap” behavior—price travels quickly because there’s limited opposing activity at that level.
This is especially useful as a breakout filter:
- Breaks with low sweep volume may be cleaner continuations.
- Breaks with heavy sweep volume may be more prone to rejection or mean-reversion, depending on where the candle closes and what follows next.
Indicator Logic and Methodology
A “sweep” occurs when market price extends beyond a previous structural high or low but fails to sustain that breakout, often leaving a wick and closing back inside the prior structure. The Sweep Volume Index breaks this into a clear process so the plotted values represent sweep-specific volume rather than generic candle volume.
- Pivot Identification: The indicator identifies structural pivot highs and lows based on the Pivot Length input.
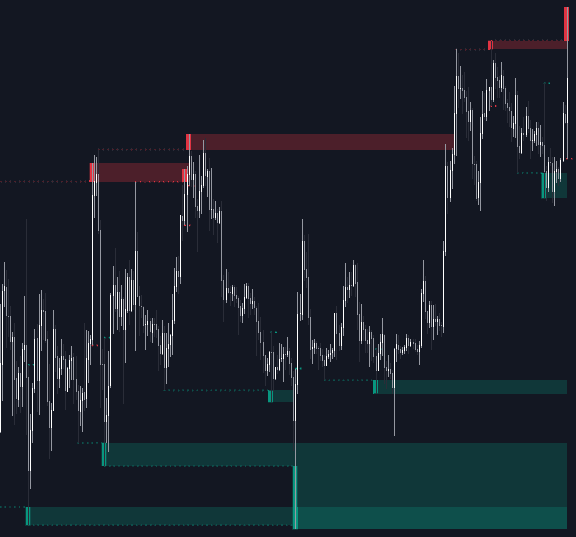
- Threshold Zone: A dynamic ATR-based threshold is applied to these levels. This zone defines the area where price can “pierce” without the candle body closing outside, qualifying the move as a sweep rather than a breakout.
- Intrabar Analysis: Using
request.security_lower_tf, the script analyzes the volume on a lower timeframe. It only counts volume traded beyond the pivot level during the sweep. - Sweep Volume Calculation: Bullish Sweep Volume measures volume traded above a Pivot High while the candle body remains below the threshold. Bearish Sweep Volume measures volume traded below a Pivot Low while the candle body remains above the threshold.
Because the calculation is intrabar-based, this trading indicator can reveal participation that is invisible on a single higher-timeframe candle. This makes it particularly effective for traders who focus on:
- liquidity sweeps / stop-runs
- breakout validation
- reversal entries at swing highs/lows
- market structure concepts using pivots
Settings and Configuration Guide
Detection
- Pivot Length: Determines the lookback/lookahead period for identifying structural swing highs and swing lows.
Higher values generally identify more significant swings (fewer signals), while lower values detect more frequent micro-structure pivots (more signals).
Calculation
- Intrabar Timeframe: The lower timeframe used to calculate granular volume data. Lower timeframes provide higher precision.
If you choose a very low intrabar timeframe, make sure the chart has enough historical coverage for consistent results.
Threshold
- Use ATR Threshold: Enables a buffer zone around pivots. If the candle body closes within this zone (but beyond the pivot), it is still considered a sweep.
This helps separate “true breakouts” from common sweep behavior where price briefly exceeds the level but fails to hold it. - ATR Length: The period used for the Average True Range calculation.
- ATR Multiplier: Multiplier applied to the ATR to define the width of the sweep zone.
Larger multipliers create a wider threshold (more moves qualify as sweeps), while smaller multipliers tighten the definition.
Envelopes
- Envelope Alpha %: Controls the rate at which the oscillator envelopes decay. Higher values make the envelopes stay elevated for longer.
Use this to better compare current sweep volume against recent “baseline” sweep activity. - Upper/Lower Envelope Color: Sets the colors for the bullish and bearish oscillator envelopes.
Visuals
- Show Swing Levels: Toggles the visibility of the horizontal pivot lines and ATR zones on the main chart.
- Show Oscillator Fills: Toggles the gradient fills within the oscillator pane.
- Bullish/Bearish Sweep Color: Sets the colors for the volume columns in the oscillator.
- Pivot High/Low Colors & Zones: Customizes the colors for the price levels and the shaded threshold areas on the chart.
FAQ
What does the Sweep Volume Index measure?
It measures the volume traded specifically during liquidity sweeps past swing highs and swing lows, using intrabar data to isolate activity beyond pivot levels rather than counting total candle volume.
How can this trading indicator improve a breakout trading strategy?
It helps you filter breakouts by showing whether a move beyond a key level had heavy sweep participation (often linked to stop-runs and potential rejection) or cleared the level with low sweep volume (sometimes linked to faster continuation).
Why does the Sweep Volume Index require a lower timeframe?
Because the indicator uses intrabar calculations (via request.security_lower_tf) to count only the volume traded beyond the pivot level during a sweep. Without lower timeframe data, that precision isn’t possible.
How do I access Sweep Volume Index?
You can get access on the LuxAlgo Library for charting platforms like TradingView, MetaTrader (MT4/MT5), and NinjaTrader for free.
Free indicator
Get free access to this indicator on the platforms below.
Unlock the entire LuxAlgo Library
Every indicator, every strategy, full charts, and complete access to Quant — our AI agent.