Concept
Sweep Detection
Sweep Detection is a Volume & Order Flow concept. The Library holds 1 implementation, a working definition you can pull into Quant.
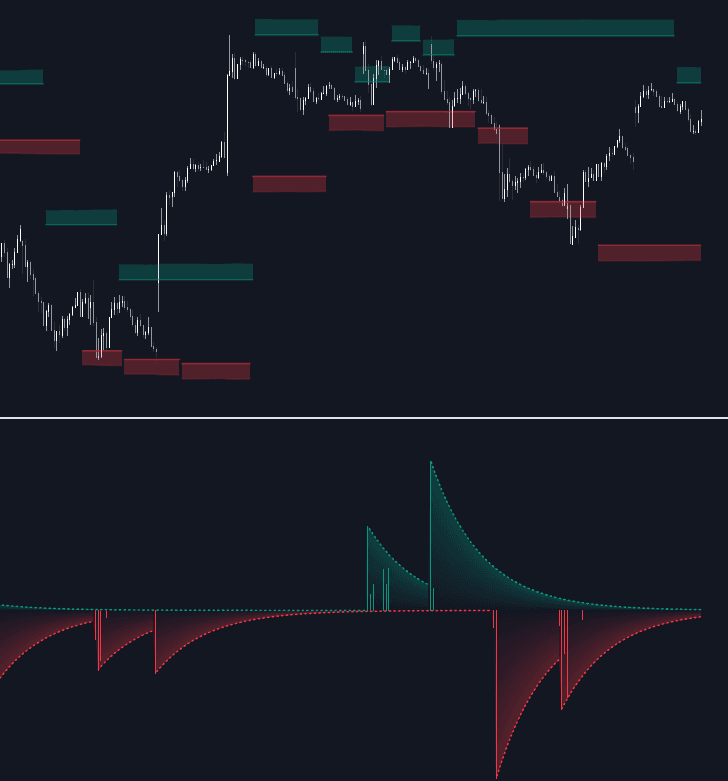
Top Sweep Detection indicator
The top custom implementation, built on the original standard Sweep Detection formula.
1 total
The Sweep Detection implementation below can become a backtested trading strategy — describe your rules and Quant writes the code.
What is Sweep Detection?
Sweep detection is the order-flow practice of reconstructing sweeps from the tape: aggressive executions that consume resting liquidity across several price levels almost simultaneously. On time and sales, a sweep appears as a burst of same-direction prints at successively higher (or lower) prices within a very short window, often milliseconds, as one marketable order walks through the book. Detection logic groups prints by timestamp proximity, aggressor side, and stepping price, then merges them into a single event with a total size.
The behavior exists because resting liquidity is stacked in a limit order book: only so much size rests at the best price, so a larger marketable order must walk deeper, level by level, until filled. In fragmented US equities, Reg NMS even defines a dedicated order type for the purpose, the intermarket sweep order, which routes to multiple venues simultaneously rather than waiting for sequential order-protection checks. Options traders monitor the same behavior across exchanges, which is why large multi-venue option sweeps are a staple of flow-tracking services.
A sweep signals urgency: the participant chose immediacy over price, accepting slippage to be filled now. That separates it from patient execution styles that rest limit orders or negotiate size off the book; detectors therefore treat aggression, not size alone, as the interesting fact. Note the naming collision: this microstructure event is not the Smart Money Concepts liquidity sweep, which describes price running stops beyond a swing level rather than an execution style.
Detection quality is bounded by the feed. Separating one genuine sweep from coincidental prints requires sub-second timestamps and reliable aggressor-side inference, exactly the detail that consolidated or throttled feeds blur. That is why chart-based tools often approximate sweeps from lower-timeframe volume delta and volume spikes rather than raw tape events, and why thresholds tuned on one instrument rarely transfer to another.
How to identify sweeps on time and sales
Sweeps are read from the tape; the chart supplies context.
- 1Watch for bursts: a run of same-side prints landing within milliseconds at successively higher or lower prices, often ending with the quote stepping to a new level.
- 2Merge each burst into one event: total the size, note the price range covered and the direction. That aggregate is the sweep, not any single print.
- 3Screen for significance: require a minimum total size relative to the instrument's typical prints and a minimum number of levels consumed, or routine activity floods the log.
- 4Cross-check the chart: a meaningful sweep usually leaves a footprint in relative volume and a step in cumulative delta at the same timestamp.
- 5Map the location: events at prior extremes, the session VWAP, or a value area edge deserve attention; most others resolve to noise.
How traders use it
- As confirmation of initiative: repeated same-direction sweeps into or through a level suggest aggressive participants are driving, which supports breakout and continuation reads better than passive drift does; many combine this with tape reading or delta tools.
- As an urgency screen against size alone: block trades are large but often negotiated and patient, while a sweep of comparable size implies someone paid up for speed, which is usually the more informative fact.
- As an alert primitive near levels: sweeps firing at a prior high or low, an anchored VWAP, or a value-area edge flag urgent activity exactly where it matters.
- As an absorption test: repeated sell sweeps that fail to produce lower lows imply passive buyers are soaking up the aggression, a print-level cousin of volume divergence; the missing price response is the message.
- As a chartable series: summing signed sweep volume over time yields a running line in the spirit of OBV but restricted to urgent flow, the construction behind sweep-volume indices. The read stays probabilistic: a sweep proves aggression, not intent, and can be a hedge or an exit as easily as new positioning.
Sweep detection vs related volume reads
Volume Spike: A volume spike is a bar-level anomaly: far more volume than usual, direction unresolved. A sweep is a print-level event with a known aggressor side and level count. A spike says something happened in the bar; sweep detection says who forced it and how urgently.
Volume Delta: Delta nets buyer-initiated against seller-initiated volume across a bar, so a sweep and its counter-flow can cancel to nothing. Sweep detection keeps the individual event with its size, speed, and range. Delta is the summary line; sweeps are the line items.
Volume at Breakout: Volume at breakout asks whether a level break carried participation, judged from bar totals. Sweep detection answers a finer question: whether someone paid up through the level in one urgent order, often the difference between a driven break and a drift.
Concept family
Volume & Order Flow
88 concepts mapped · 88 in the Library
Sweep Detection FAQ
Turn Sweep Detection into a trading strategy.
Take the implementation from this page into Quant, then build on it, backtest it on real data, and keep refining it in conversation.