


Sweeps & IFVGs
 by LuxAlgo · Jun 4, 2026
The Sweeps & IFVGs indicator is a powerful technical analysis tool designed to identify liquidity sweep events and potential market reversals using Inverse Fair Value Gaps (IFVG) to provide traders with actionable supply and demand insights.
Usage
The Sweeps & IFVGs indicator is used to map out areas where market participants are likely to have stop loss orders, known as liquidity sweeps, and to monitor price action shifts through Inverse Fair Value Gaps.
Liquidity Sweeps
This feature identifies when the price temporarily pushes past a previous swing high or low before reversing. This behavior often signals that larger market participants are collecting liquidity. You can customize the lookback period using the Swings setting to capture shorter or longer term pivots. The Sweep Options allow you to choose whether to focus strictly on price wicks, or to include instances where the price breaks through and retraces.
Inverse Fair Value Gaps (IFVG)
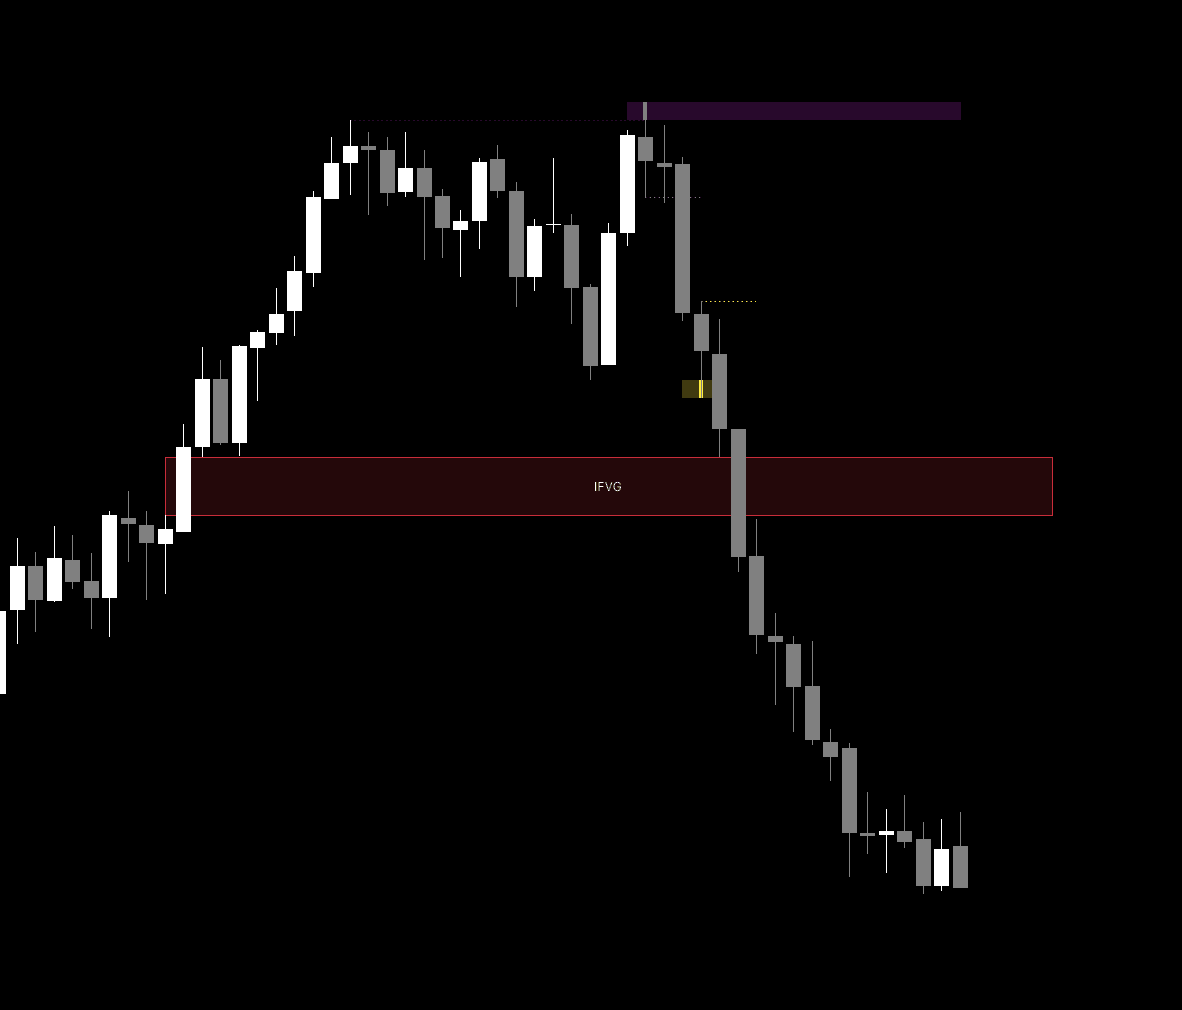
IFVGs represent gaps that were originally formed to provide momentum in one direction but have since been invalidated by price action moving in the opposite direction. These zones often act as significant support or resistance levels. When an IFVG is confirmed, the indicator highlights it on the chart, allowing traders to anticipate potential reaction zones when the price returns to these levels.
Details
The script functions by tracking structural pivots to detect liquidity sweeps. When the price moves beyond a previous pivot high or low, the indicator visually marks these events with customizable zones that can be extended across the chart.
The IFVG logic functions by monitoring price gaps. When a gap is identified, the script calculates its size relative to the Average True Range (ATR). Only gaps exceeding the user defined volatility filter are marked, ensuring that traders focus on significant market movements. Once a gap is breached by the closing price, it is transformed into an IFVG, which suggests a shift in institutional sentiment. The indicator includes a limit on the number of displayed IFVGs to maintain a clean chart environment.
Settings
Liquidity Sweeps
- Swings: Sets the lookback period used to identify swing highs and lows.
- Sweep Options: Select between displaying only wicks, only outbreaks and retests, or both.
- Bullish/Bearish Sweep Colors: Customize the visual representation of liquidity sweeps on your chart.
Sweep Area
- Extend Sweep Areas: When enabled, the indicator visually extends the sweep zones to the right.
- Max Bars to Extend: Defines the maximum number of bars a sweep zone will persist on the chart.
- Bull/Bear Area Color: Sets the fill colors for the extended liquidity zones.
IFVG Settings
- Show Inverse FVGs: Toggles the display of IFVG zones.
- Volatility Filter Multiplier: Filters out smaller gaps by using a multiplier of the ATR, ensuring only significant gaps are processed.
- IFVG Bullish/Bearish Color: Defines the color of the IFVG boxes.
- Max Displayed IFVGs: Limits the number of active IFVGs shown to keep the workspace organized.
Alert Settings
- Alert on Liquidity Sweeps: Toggles audible or visual notifications when a sweep event is detected.
- Alert on IFVG Inversions: Toggles notifications when an FVG is officially inverted.
FAQ
How can I access the Sweeps & IFVGs indicator?
You can get access on the LuxAlgo Library for charting platforms like TradingView, MetaTrader (MT4/MT5), and NinjaTrader for free.
Trading & investing are risky and many will lose money in connection with trading and investing activities. All content on this site is not intended to, and should not be, construed as financial advice. Decisions to buy, sell, hold or trade in securities, commodities and other investments involve risk and are best made based on the advice of qualified financial professionals. Past performance does not guarantee future results.
Hypothetical or Simulated performance results have certain limitations. Unlike an actual performance record, simulated results do not represent actual trading. Also, since the trades have not been executed, the results may have under-or-over compensated for the impact, if any, of certain market factors, including, but not limited to, lack of liquidity. Simulated trading programs in general are designed with the benefit of hindsight, and are based on historical information. No representation is being made that any account will or is likely to achieve profit or losses similar to those shown.
Testimonials appearing on this website may not be representative of other clients or customers and is not a guarantee of future performance or success.
As a provider of technical analysis tools and strategies, we do not have access to the personal trading accounts or brokerage statements of our customers. As a result, we have no reason to believe our customers perform better or worse than traders as a whole based on any content, tool, or platform feature we provide.
Charts used on this site are by TradingView in which the majority of our technical indicators are built on. TradingView® is a registered trademark of TradingView, Inc. www.TradingView.com TradingView® has no affiliation with the owner, developer, or provider of the Services described herein.
Market data is provided by CBOE, CME Group, BarChart, Massive, CoinAPI. Select U.S. equities data is provided through Massive. CBOE BZX real-time U.S. equities data is licensed from CBOE and provided through BarChart. Real-time futures data is licensed from CME Group and provided through BarChart. Select cryptocurrency data, including major coins, is provided through CoinAPI. All data is provided “as is” and should be verified independently for trading purposes.
This does not represent our full Disclaimer. Please read our full disclaimer.
© 2026 LuxAlgo Global, LLC.