T3
 By LuxAlgoMay 18, 2026
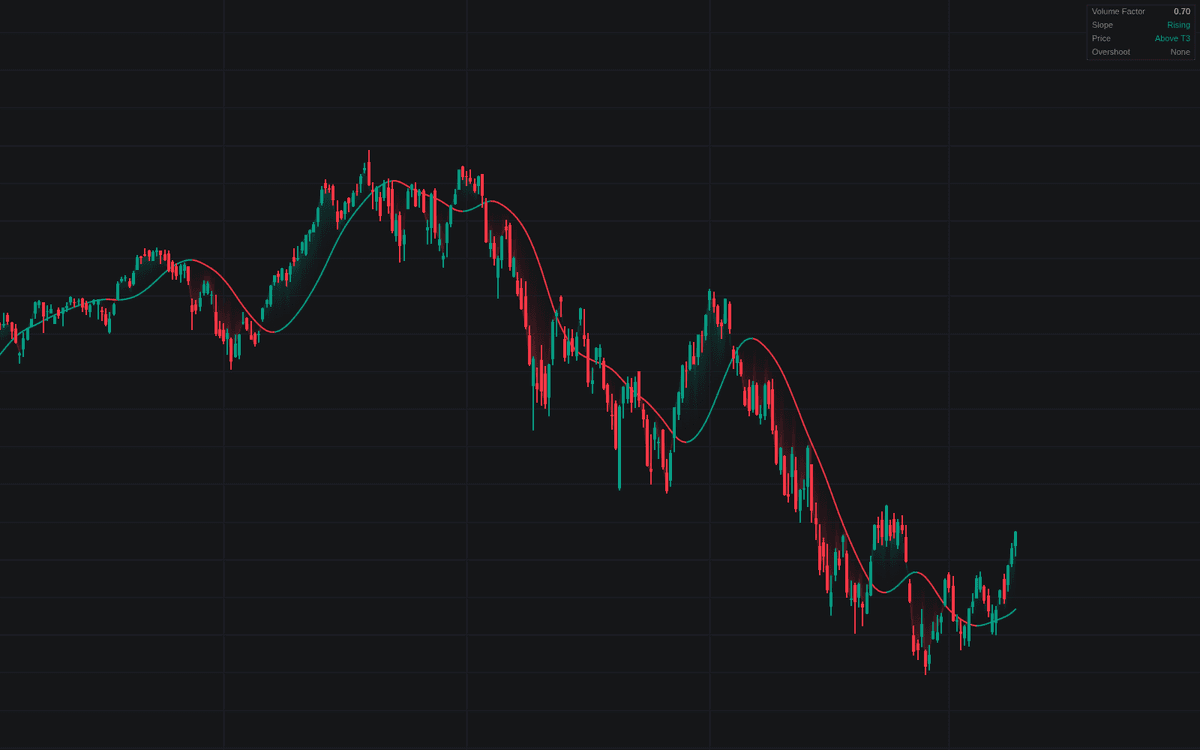

T3 is the definitive clean take on Tim Tillson's T3 smoother: three passes of generalized DEMA expanding into six cascaded EMAs recombined with volume-factor coefficients. The line is unusually smooth for its lag, drawn with slope coloring, a gradient fill to the source and two comparison overlays (a plain same-length EMA and the v = 0 triple cascade) showing what it buys.
How to Trade the T3?
- Slope color flips: the heavily smoothed curve turns direction sparingly, so its tint reads as a steady bias, though real reversals register late.
- Price crossing the T3: shifts the position read; in trends the curve gives pullbacks a dynamic reference, though nothing forces price to respect it.
- Fast T3 crossing the main line: the optional pair adds crossovers printing less often, and later, than the equivalent EMA setup.
The dashboard reports the volume factor's temperament, slope, price's side and any overshoot, the trait separating T3 from classic trend overlays: after a violent turn the curve can briefly run beyond its input's last N bars.
T3 Settings
- Source (default close): T3 is series-agnostic and routinely run over oscillators or volume as well as price.
- T3 Length (default 14): shared by all six EMA stages; equal lengths do not translate across MA families.
- Volume Factor (default 0.7): the temperament dial: 0 collapses the build to a triple EMA cascade, 1 makes every stage a full DEMA.
- Fast T3 (default disabled) with Fast T3 Length (default 5): the crossover pair; both share one volume factor.
- EMA — Same Length (default disabled) and Triple EMA Cascade (v = 0) (default disabled): comparison overlays.
- Style and dashboard toggles cover slope coloring, line width, the gradient fill, crossing markers and the panel.
Frequently Asked Questions

Original indicatorBuilt in-house by LuxAlgo
The Library is free. Quant makes it yours.
Pull any concept or indicator into Quant: rebuild it, retune it, or turn it into a backtested strategy of your own.