The Range Indicator
 By LuxAlgoJul 27, 2026
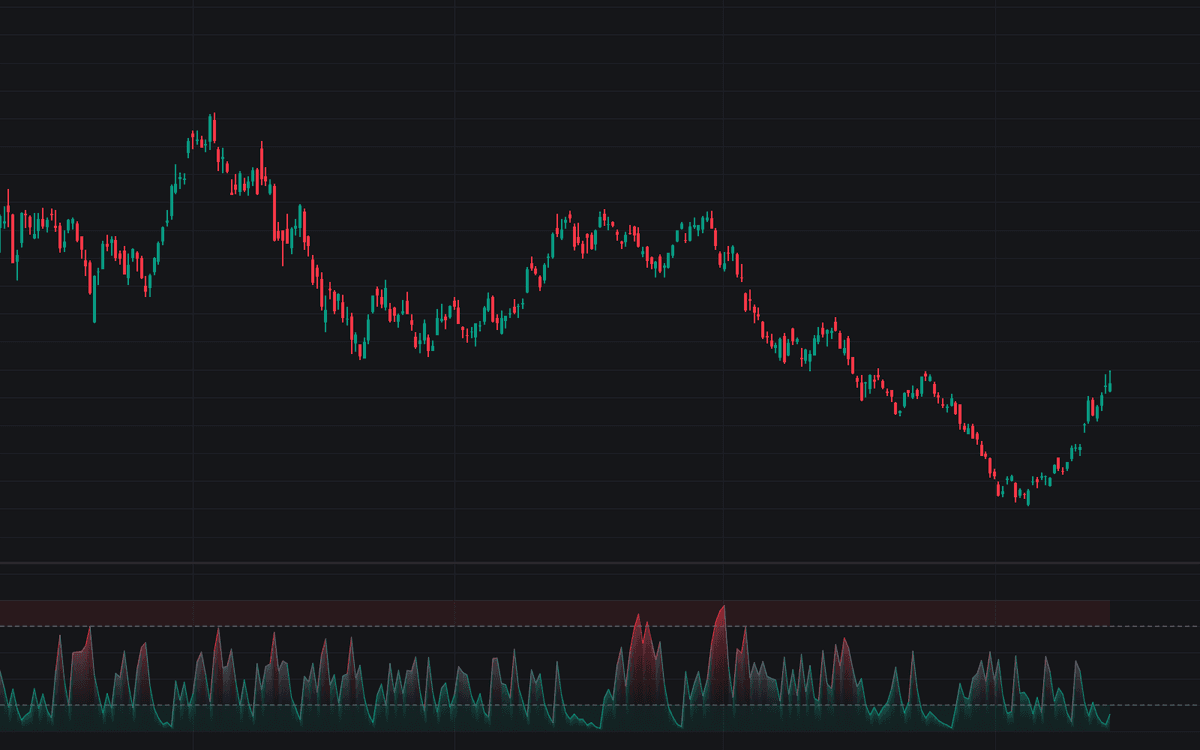

The Range Indicator measures whether bars are covering ground or just covering range. Each bar's true range is set against its close-to-close progress, the ratio at the heart of The Range Indicator, then normalized stochastic-style over a lookback and smoothed into a 0–100 line with a gradient fill beneath it, a clean first rendering of Weinberg's study. High readings say in-bar churn is swamping the ground gained, the condition he read as a trend-ending warning; low readings say travel is efficient.
How to Trade The Range Indicator?
- Cross above the High Threshold: churn extreme, effort rising while progress stalls; the Churn Extreme alert fires, and Churn Easing marks the cross back down.
- Cross below the Low Threshold: efficient travel, progress large relative to in-bar noise, the environment Weinberg's study associated with trending conditions; Efficient Travel and Efficiency Fading alerts bracket the stay.
- Between the thresholds: no regime claim. Context for other tools, not a trigger.
The Range Indicator Settings
- Normalization Length (default 10): lookback of the stochastic-style normalization. Longer makes extreme readings rarer and steadier.
- Smoothing Length (default 3): EMA applied to the normalized series; shorter is jumpier, longer slower.
- Degenerate Window Handling (default Output Zero): value used when the window's highest and lowest raw ratios coincide; Hold Previous Value is the other published convention.
- Show Thresholds (default on) with High Threshold (default 80) and Low Threshold (default 20): the churn and efficiency levels (70 and 30 are also common).
- Style: Gradient Fill (default on).
Frequently Asked Questions

Original indicatorBuilt in-house by LuxAlgo
The Library is free. Quant makes it yours.
Pull any concept or indicator into Quant: rebuild it, retune it, or turn it into a backtested strategy of your own.