Concept
The Range Indicator
The Range Indicator is a Volatility concept. The Library holds 1 implementation, a working definition you can pull into Quant.
TRI
Top The Range Indicator indicator
The top custom implementation, built on the original standard The Range Indicator formula.
1 total
From studying The Range Indicator to trading it: take the implementation below into Quant and backtest it instantly.
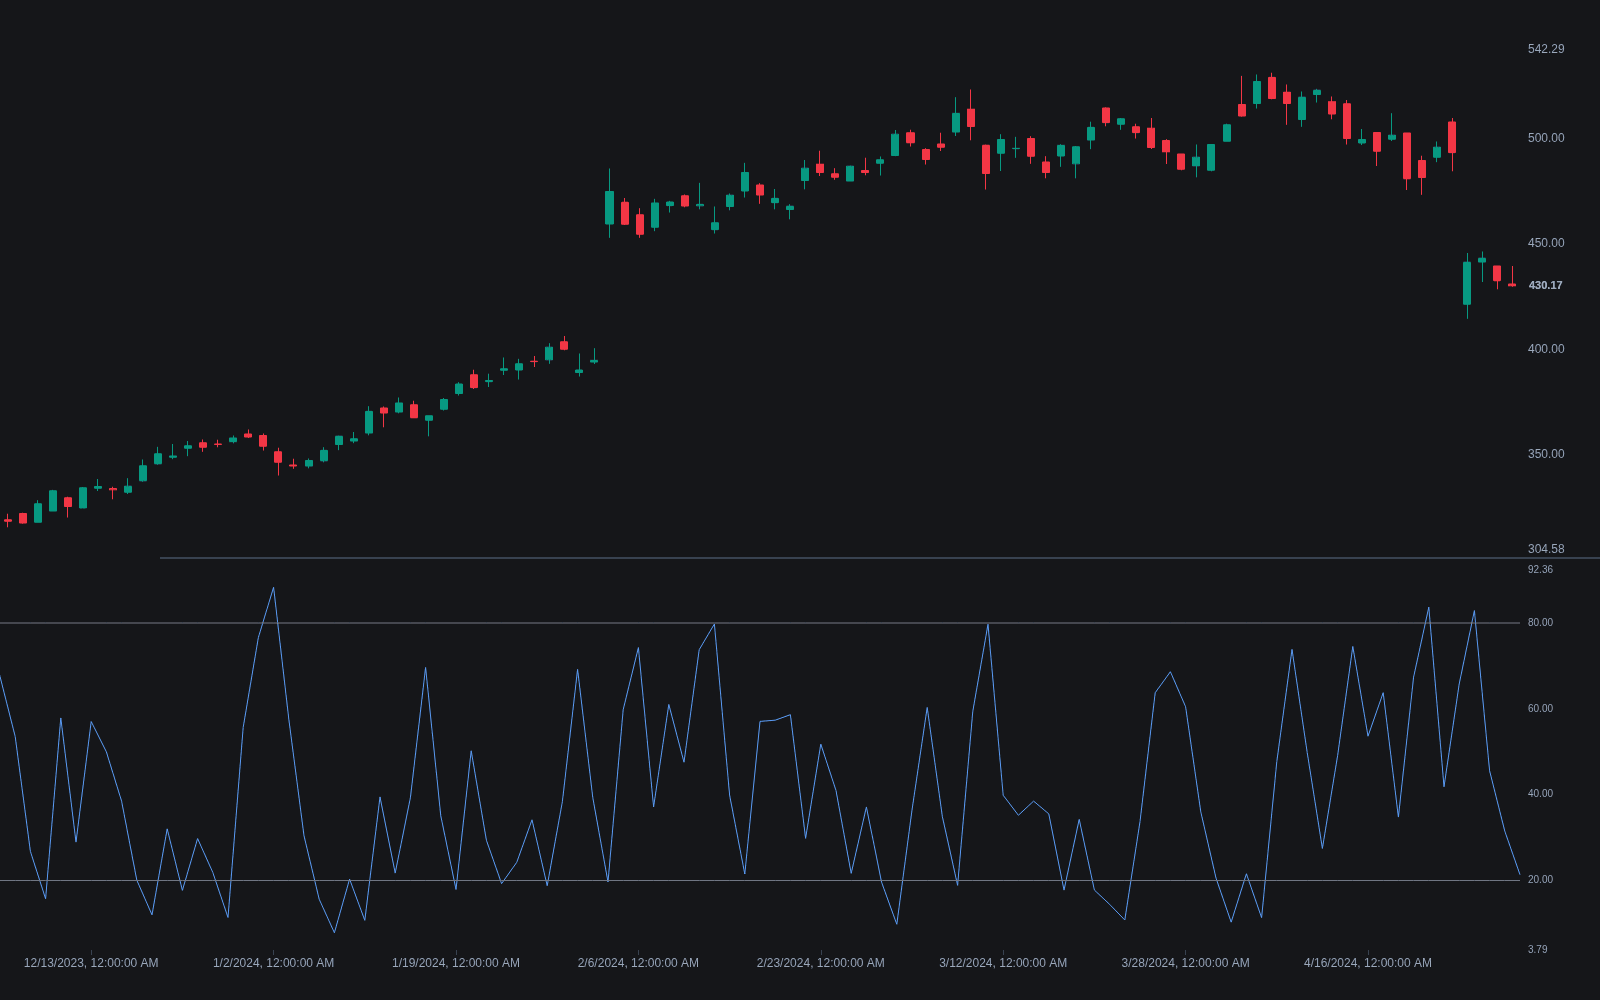
What is The Range Indicator?
The Range Indicator, often abbreviated TRI, is Jack Weinberg's study comparing each bar's intraday range with the interday change, published in Technical Analysis of Stocks and Commodities in 1995. The premise: in a healthy trend, price makes progress from close to close that is large relative to the churn inside each bar. When the intraday range starts dwarfing the close-to-close movement, effort is rising while progress stalls, which Weinberg read as a sign the current trend may be ending.
Mechanically, TRI builds a ratio of true range to the close-to-close change on up-closing bars, falls back to the raw true range otherwise, normalizes that series through a stochastic-style calculation over a lookback, and smooths the result with a short EMA. The output is bounded between 0 and 100, which makes threshold rules practical.
Traders care because TRI packages a genuinely different question than most volatility tools. ATR asks how big the bars are; TRI asks how big they are relative to the ground actually gained, which is closer to a trend-efficiency reading expressed through volatility. High readings flag inefficient churn, low readings flag efficient travel.
How it's calculated
A stochastic-normalized, smoothed ratio of intraday true range to interday price change, as published by Weinberg.
The ratio is only formed on up-closing bars: a flat close would put zero in the denominator, and a down close would flip the ratio's sign; implementations vary in how they handle flat closes.
If max and min coincide over the window, the normalization is degenerate and platforms typically output zero or hold the prior value.
How traders use it
- As a trend-exhaustion alert: readings pushing toward the top of the scale, often read above 70 or 80, show intraday churn overwhelming close-to-close progress, a condition that in Weinberg's work tended to accompany the late stage of a move.
- As a trend-onset filter: low readings, often below 20 or 30, indicate bars are traveling efficiently, an environment where trend-following entries have historically fared better than in high-TRI churn.
- Combined with direction tools: TRI says nothing about which way price will resolve, so traders pair its extremes with structure, momentum, or a stochastic oscillator style trigger for timing.
- Its limitations: the up-close-only ratio makes the raw series asymmetric, the stochastic normalization makes readings lookback-relative rather than absolute, and on gappy or thin instruments single bars can pin the normalization window and mute the signal for days.
The Range Indicator vs adjacent readings
ATR: ATR measures the size of bars in price units with no reference to progress made. TRI measures range relative to close-to-close change and normalizes to a bounded scale, so it reads efficiency rather than raw magnitude.
Kaufman Efficiency Ratio: Both target trend efficiency, but the efficiency ratio divides net displacement by the sum of absolute close-to-close moves over a window, ignoring intrabar range entirely. TRI works bar by bar from true range versus interday change.
Choppiness Index: The Choppiness Index compares summed true range to the window's total high-low span to classify trending versus congested conditions. TRI makes a similar diagnosis but anchors to close-to-close progress and updates faster through its short smoothing.
Concept family
Volatility
57 concepts mapped · 57 in the Library
The Range Indicator FAQ
Turn The Range Indicator into a trading strategy.
Take the implementation from this page into Quant, then build on it, backtest it on real data, and keep refining it in conversation.