Tirone Levels
 By LuxAlgoMay 31, 2026
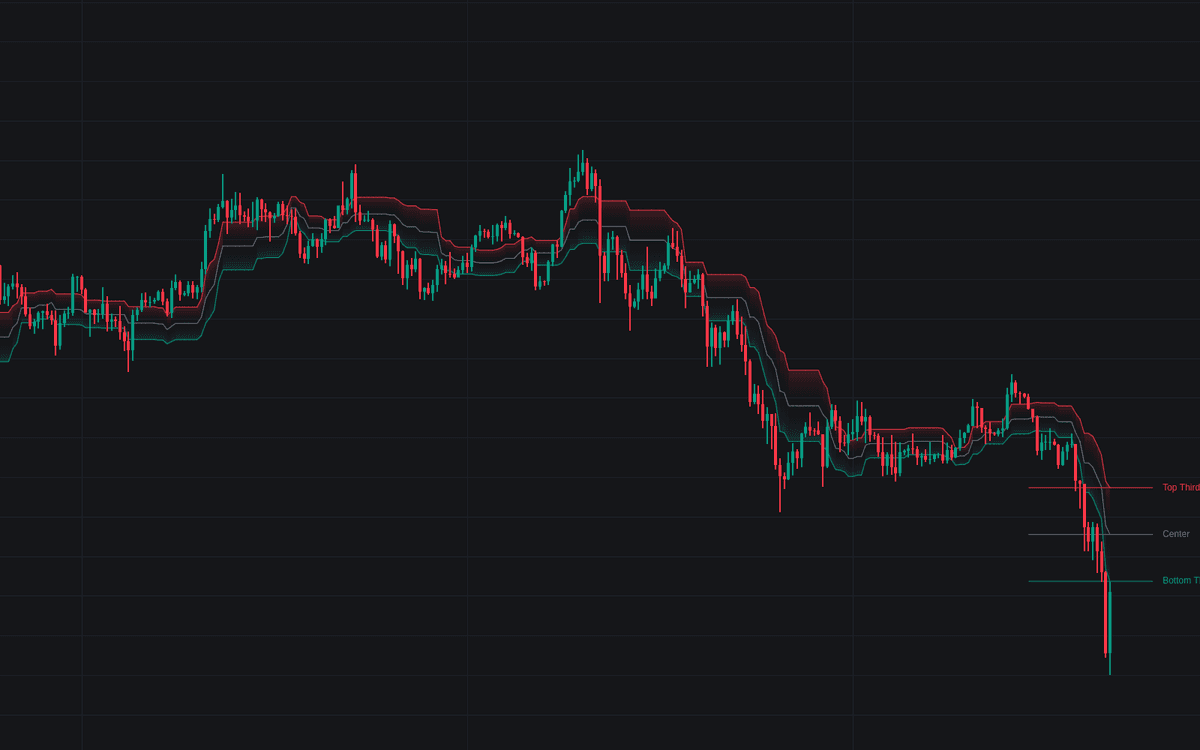

Tirone Levels builds the ladder both published ways, the first faithful implementation of Tirone levels in the library. From the measured window's highest high and lowest low it draws the midpoint set (Top Third, Center and Bottom Third) and, on request, the mean method's Regular and Extreme highs and lows around the Adjusted Mean. The window is a 20-bar rolling lookback or an anchored range from a chosen time; the current ladder extends right with name labels, and the plotted history shows how each level redrew as new extremes printed.
How to Trade the Tirone Levels?
- Center / Adjusted Mean: the middle of the frame. Closes crossing the Center line are the range's mean-reversion events, alerted both ways.
- Third entries: a close crossing into the Top Third or Bottom Third puts price in the outer zones of the traveled range, the classic fade areas in sideways conditions, both alerted.
- Range failure: a close beyond the mean method's Extreme High or Extreme Low says the measured range no longer holds price. Breakout territory, alerted on each side.
Tirone Levels Settings
- Method (default Midpoint): Mean draws the ladder around the adjusted mean instead; Both overlays the two sets.
- Show Adjusted Mean (default on): plots the (H + L + C) / 3 anchor as a middle line of the mean set.
- Window (default Rolling) with Rolling Length (default 20): the measured lookback; Anchor Time (default 01 Jan 2024) fixes the window's start when Anchored is selected.
- Style: Historical Levels, Gradient Zones and Level Labels (all on), plus Rightward Extension (default 10) for the current ladder.
Frequently Asked Questions

Original indicatorBuilt in-house by LuxAlgo
The Library is free. Quant makes it yours.
Pull any concept or indicator into Quant: rebuild it, retune it, or turn it into a backtested strategy of your own.