Concept
Tirone Levels
Tirone Levels, also known as mean levels, are Support/Resistance & Levels concepts. The Library holds 1 implementation, a working definition you can pull into Quant.
Top Tirone Levels indicator
The top custom implementation, built on the original standard Tirone Levels formula.
1 total
From studying Tirone Levels to trading it: take the implementation below into Quant and backtest it instantly.
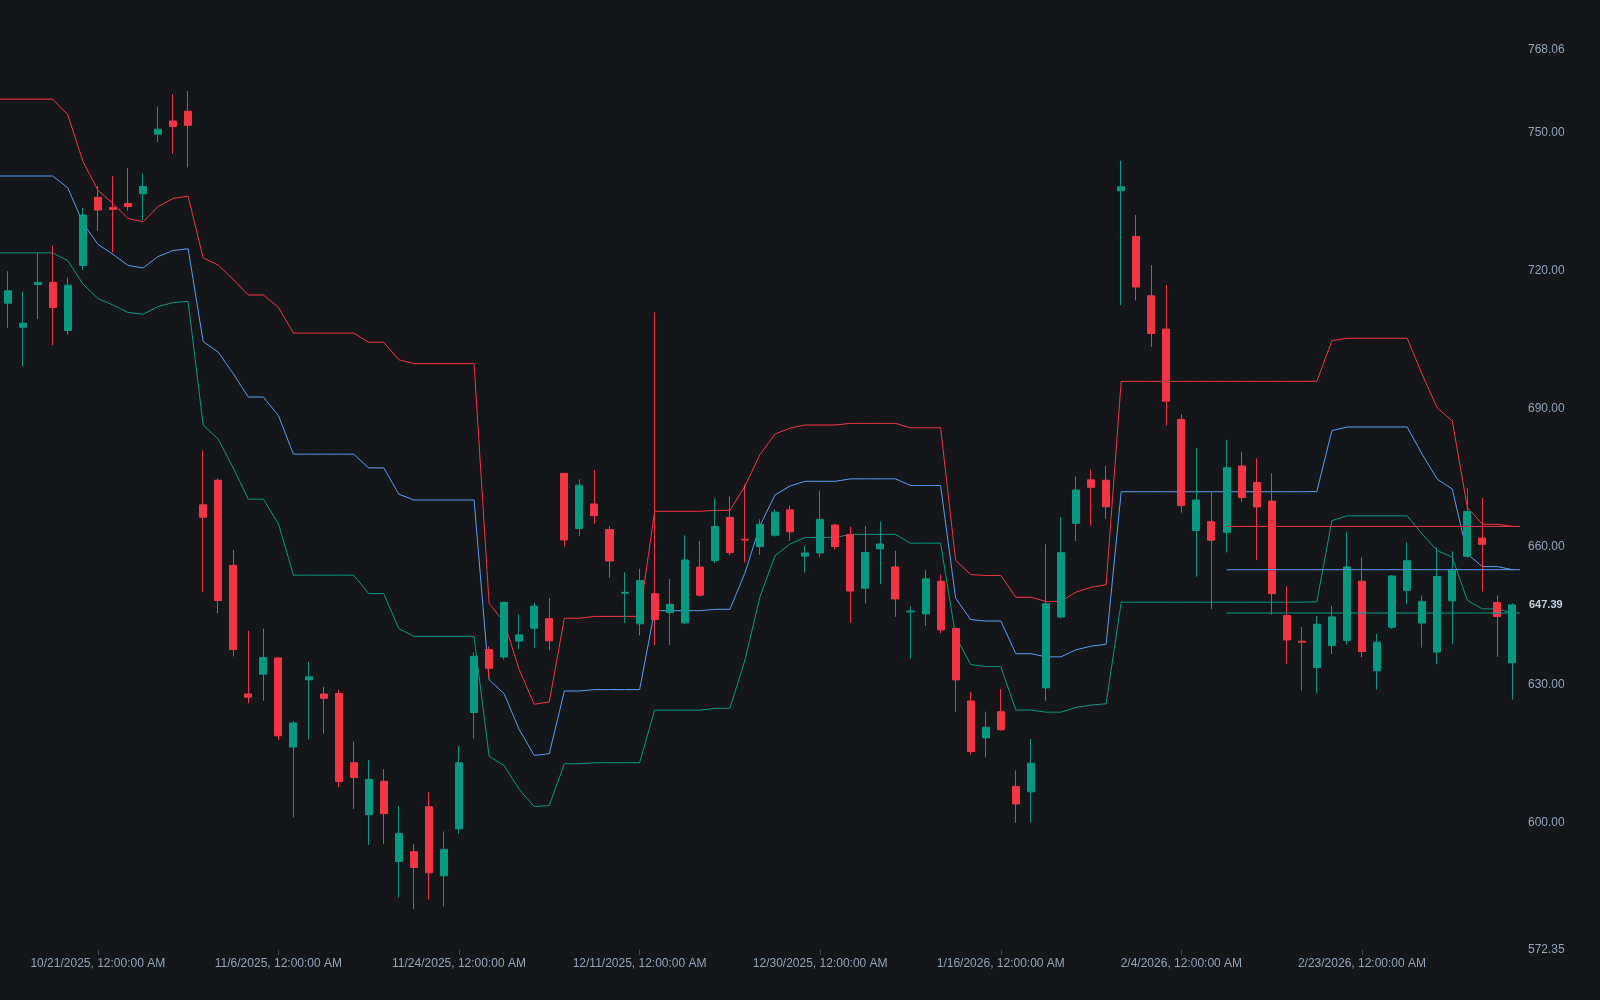
What are Tirone levels?
Tirone levels are horizontal support and resistance lines derived from the highest high and lowest low of a chosen lookback window, attributed to analyst John Tirone. Instead of projecting from a single prior session the way pivot systems do, they carve the traveled range itself into reference prices, on the premise that a market tends to react at simple fractions of its recent range.
Two constructions circulate. The midpoint method draws three lines splitting the high-to-low range into thirds plus its midpoint, giving a compact top, center, and bottom frame. The mean method, whose output is often called mean levels, builds five lines around an adjusted mean of the high, low, and close, producing a wider ladder that resembles a pivot grid stretched over the lookback range. Charting platforms vary in which variant they ship and in the exact line set, so two implementations labeled Tirone levels may not match.
Traders care about them for the same reasons as other computed levels: they are objective, reproducible, and available without discretion. Their obvious limitation is that the lines are arithmetic subdivisions rather than prices where notable business is known to have occurred, so they carry weight only when price demonstrates respect for them or when they coincide with independently derived references.
How it's calculated
Both variants start from the extreme prices of the lookback window.
Lookback length is user-chosen; common defaults run from 20 bars to several months of data.
Some platforms also plot AM itself as a middle line, giving the mean method five or six lines depending on implementation.
How traders use it
- As a range frame: in sideways markets the top and bottom thirds serve as fade zones and the center line as the mean-reversion target, similar in spirit to trading any well-defined S/R zone structure.
- As breakout context: a close beyond the extreme lines of the mean method suggests the recent range is failing to contain price, prompting trend-continuation tactics rather than fades.
- As confluence input: a Tirone line gains standing when it overlaps a level with independent logic, such as a prior swing, a volume node, or a round number.
- With refresh discipline: the levels move whenever the window's high or low changes, so traders either anchor the window to a fixed structural range or accept that the ladder redraws as new extremes print.
- Honestly weighted: Tirone levels see little modern usage and little published validation, so most practitioners treat them as a secondary frame rather than a primary edge.
Tirone levels vs other computed ladders
Pivot Points: Pivot systems project levels from one completed anchor session and refresh each period; Tirone levels subdivide the traveled range of a rolling or fixed lookback window, so they describe the range rather than forecast the next session.
Murrey Math Levels: Murrey math divides a framed range into eighths inside a self-similar grid with elaborate rules per line; Tirone levels are a simpler thirds or mean-based subdivision without the surrounding system.
Floor Pivots: The mean-method ladder looks like a floor pivot grid, but floor pivots use only the prior session's data while Tirone's mean method anchors to the extremes of a longer window plus the latest close.
Concept family
Support/Resistance & Levels
38 concepts mapped · 38 in the Library
Tirone Levels FAQ
Turn Tirone Levels into a trading strategy.
Take the implementation from this page into Quant, then build on it, backtest it on real data, and keep refining it in conversation.