Trend Intensity Index
 By LuxAlgoMay 6, 2026
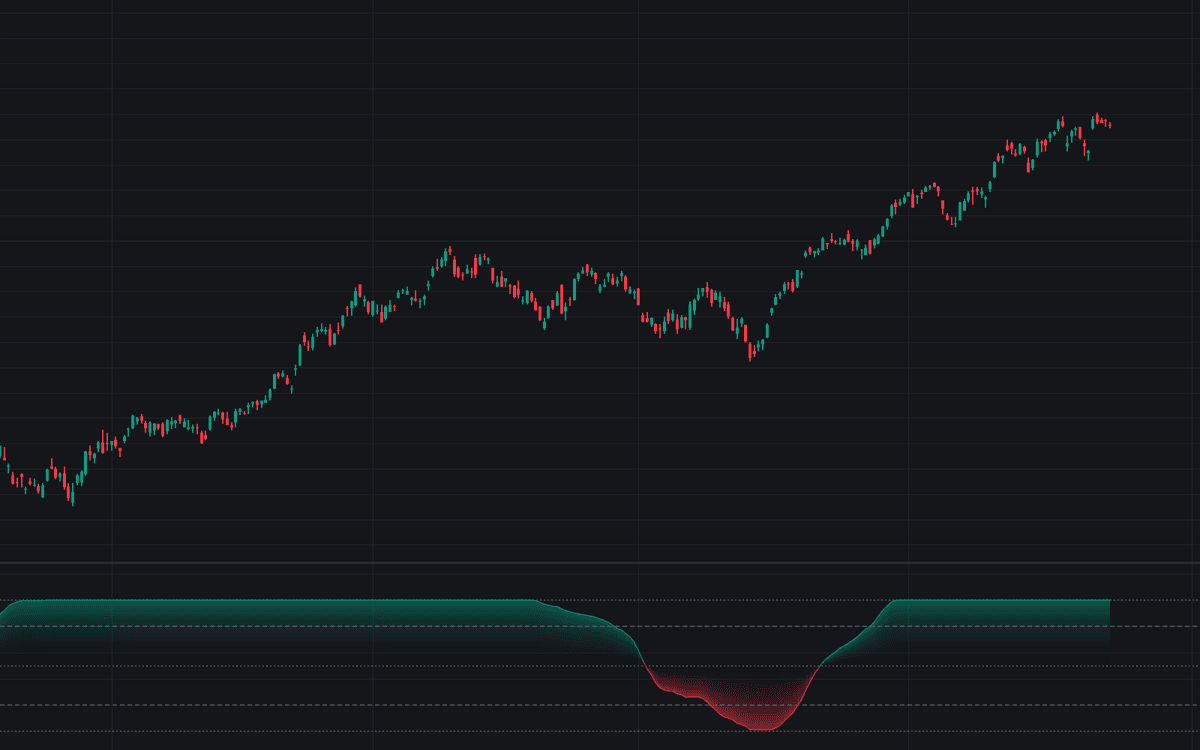

Trend Intensity Index grades how one-sided a market has been against its own average. Each bar's deviation from a simple moving average is split by sign, a recent window is summed on each side, and the upside share plots from 0 to 100, the first faithful build of the Trend Intensity Index as Pee specified it. The line colors bullish above the 50 midline and bearish below, a gradient fill anchors it to 50, and dashed trend levels sit at 20 and 80.
How to Trade the Trend Intensity Index?
- Above the Upper Level: readings over 80 grade as an established uptrend, the classic gate restricting a trend system to its long signals; the crossing up and the roll back down both carry alerts.
- Below the Lower Level: the mirrored downtrend read, with its own fading alert when the reading recovers above 20.
- Midline cross: the dominant side of the average flips; optional circles mark the spot and alerts cover both directions even with markers hidden.
Trend Intensity Index Settings
- Source (default close): series measured against its own moving average, per the original specification.
- MA Length (default 60): bars in the simple moving average deviations are measured from.
- Deviation Window (default 30): recent bars whose deviations are accumulated, conventionally half the MA length.
- Method (default Deviation Magnitudes): sums deviation sizes per the original design, so a market hugging its average from above still grades as trending; Bar Count counts bars on each side instead.
- Upper Level (default 80) and Lower Level (default 20): established-trend thresholds. Conventions, not optimized values.
- Style: Established Trend Background (off) and Midline Cross Markers (off).
Frequently Asked Questions

Original indicatorBuilt in-house by LuxAlgo
The Library is free. Quant makes it yours.
Pull any concept or indicator into Quant: rebuild it, retune it, or turn it into a backtested strategy of your own.