Concept
Trend Intensity Index
Trend Intensity Index is a Trend concept. The Library holds 1 implementation, a working definition you can pull into Quant.
Top Trend Intensity Index indicator
The top custom implementation, built on the original standard Trend Intensity Index formula.
1 total
The Trend Intensity Index implementation below can become a backtested trading strategy — describe your rules and Quant writes the code.
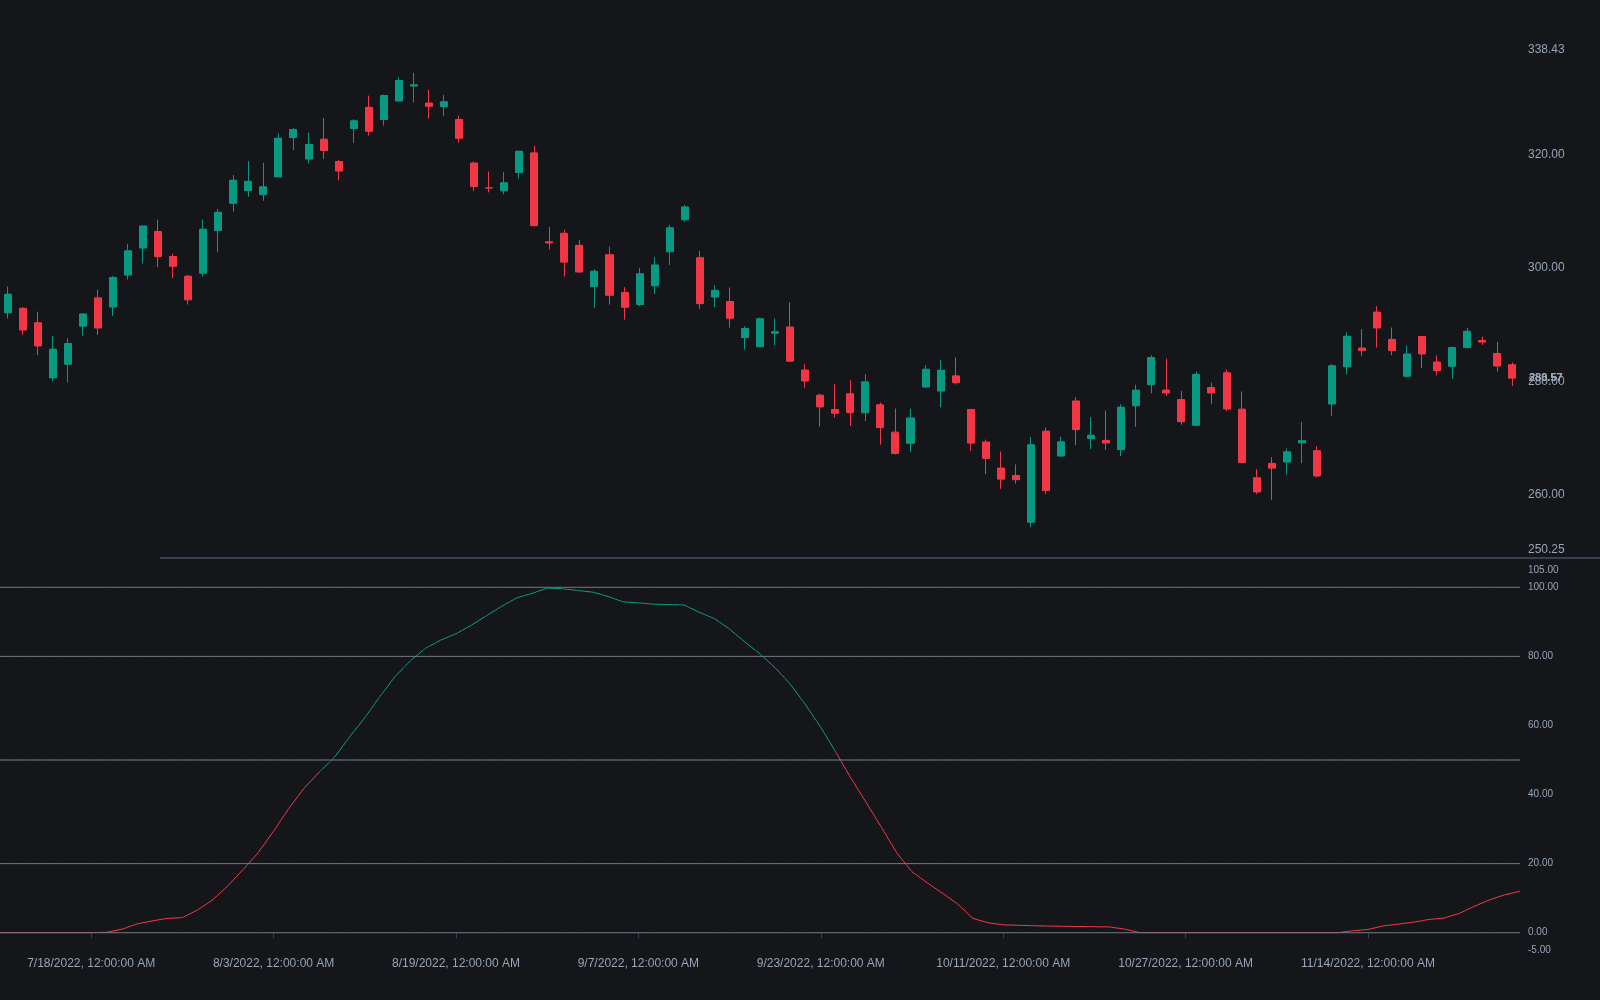
What is the Trend Intensity Index?
The Trend Intensity Index (TII) measures how one-sided price has been relative to its own moving average. Instead of asking how fast price is moving, it asks what fraction of recent deviations from a SMA landed on the upside. When nearly every recent close sits above the average, the index approaches 100; when nearly every close sits below, it approaches 0; a market oscillating around its average reads near 50. The result is a bounded 0 to 100 gauge of trend persistence.
The indicator was introduced by M.H. Pee in a 2002 Technical Analysis of Stocks & Commodities article. Its design choice is deliberate: by summing the magnitudes of positive and negative deviations rather than counting bars, a market that hugs its average from above scores as strongly trending even if individual bars are small, while a market that whips violently to both sides scores near neutral no matter how large the bars are.
Traders use it because trend-following entries taken in non-trending conditions are the largest source of whipsaw losses. A persistence gauge like the TII is a cheap way to require that the market has already been picking a side before committing to a directional system.
How it's calculated
Deviations of close from a moving average are split by sign over a recent window and the upside share is expressed as a percentage.
Pee's original uses a 60-bar average with a 30-bar deviation window.
Some implementations count bars above and below the average instead of summing deviation magnitudes; readings differ modestly but the interpretation is the same.
How traders use it
- As a directional filter: readings above 80 are commonly treated as an established uptrend and readings below 20 as an established downtrend, gating which side a trend system may trade. The 80/20 thresholds are conventions, not optimized values.
- As a breakout confirmation: a TII rising through 50 to 60 while price clears a range suggests the move has persistence behind it rather than a single impulsive bar.
- As an early-warning gauge: a TII rolling over from extreme readings while price still grinds to marginal new highs often precedes a transition into range conditions, though it gives no timing for the turn.
- Its limitations follow from the moving average inside it: the TII lags at trend starts, and in slow drifts it can pin near 100 or 0 for long stretches, so it works better as a regime gate than as a standalone entry signal. Broader alternatives are covered under trend/range classifiers.
Trend Intensity Index vs adjacent strength gauges
ADX / DMI system: ADX builds trend strength from directional movement of highs and lows; it is bounded at 100 in theory but rarely reads above 60 in practice, and it carries no direction of its own. The TII is a simpler bounded ratio anchored to one moving average, with direction encoded directly in whether it sits above or below 50.
Vertical Horizontal Filter: The VHF measures path efficiency and deliberately ignores direction, so it cannot say which way the trend points. The TII is directional by construction: high readings mean up-persistence, low readings mean down-persistence.
R-squared trend fit: R-squared scores how well a straight line explains recent prices, a regression view of trendiness. The TII scores which side of a moving average price has favored, so a curved but persistent trend can score high on TII while fitting a line poorly.
Concept family
Trend
100 concepts mapped · 100 in the Library
Trend Intensity Index FAQ
Turn Trend Intensity Index into a trading strategy.
Take the implementation from this page into Quant, then build on it, backtest it on real data, and keep refining it in conversation.