


Trend Pressure Prism
 by LuxAlgo · Feb 16, 2026
The Trend Pressure Prism indicator is an advanced trading indicator and trend-following strategy tool that combines momentum, market structure, and pullback analysis into a single composite oscillator. Designed for traders who want clear, high-conviction setups, it transforms raw price data into a structured pressure score between -100 and 100—helping you quickly identify trend strength, exhaustion phases, and filtered entry opportunities.
Unlike single-factor oscillators, the Trend Pressure Prism acts as a multi-dimensional trading strategy framework. By blending volume confirmation, EMA-based structure, and normalized momentum, it highlights only the most statistically aligned market conditions—ideal for intraday traders, swing traders, and systematic strategy builders.
How to Trade the Trend Pressure Prism Indicator
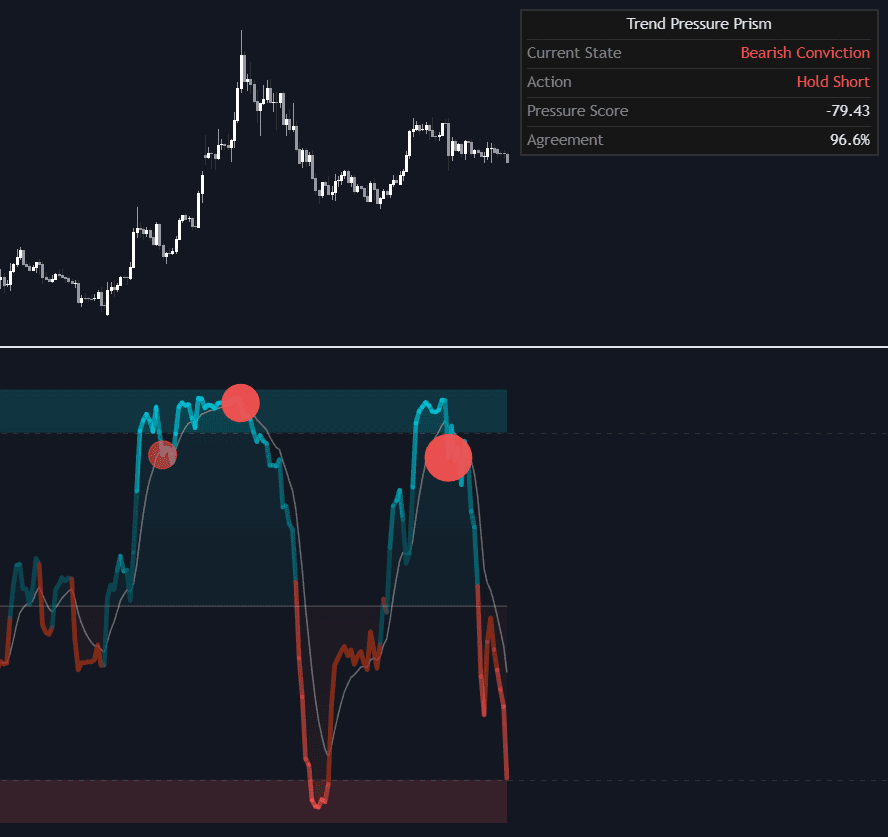
The Trend Pressure Prism works as a “market pressure lens,” refracting price action through three independent but complementary components. The result is a Composite Pressure Score and an Agreement metric that together define trend quality and conviction.
The central ribbon visualizes real-time trend pressure, while the background glow and dashboard provide contextual clarity for decision-making.
Trend States & High-Conviction Zones
The oscillator fluctuates between -100 and 100, allowing traders to clearly quantify trend intensity.
When the ribbon enters the Extreme Zones (above +80 or below -80), the background glow activates—signaling strong directional conviction.
- Bullish Conviction: Strong positive pressure with high agreement between momentum, structure, and pullback quality.
- Bearish Conviction: Strong negative pressure with structural alignment to the downside.
- Exhaustion: Pressure remains elevated, but Agreement drops below 50%, signaling divergence between internal forces and a potential trend reversal.
- Neutral / Glass State: Low pressure and low agreement, suggesting range-bound or indecisive market conditions.
This structure makes the indicator suitable for both trend-following trading strategies and mean-reversion setups when exhaustion appears.
Filtered Crossover Trading Signals
The Trend Pressure Prism includes a Signal Line (EMA) for crossover-based entries and exits. However, unlike traditional oscillators, signals are intelligently filtered to eliminate low-probability setups.
Signal Filters Include:
- Relative Volume (RVOL): Ensures breakouts are backed by elevated participation, increasing reliability.
- Agreement Filter: Requires sufficient alignment between the three internal components.
- Dynamic Sizing Visualization:
- Large, opaque circles → High-volume breakout signals.
- Smaller circles → Standard filtered opportunities.
This layered filtering approach helps traders avoid false breakouts and focus on institutional-grade moves.
Indicator Components Explained
The Composite Pressure Score is built from three core pillars:
- Momentum Drive: Uses a normalized Rate of Change to measure directional aggression.
- Structural Alignment: Evaluates price relative to fast and slow EMAs to confirm trend structure.
- Pullback Quality: Analyzes retracement depth within the recent range to assess continuation probability.
The Agreement Metric mathematically measures how aligned these three components are. When Agreement is high, it signals confluence—often preceding sustained directional moves.
This multi-factor design transforms the indicator from a simple oscillator into a complete trading system framework.
On-Screen Dashboard & Market Regime Detection
The integrated dashboard provides a real-time summary of current market conditions:
- Current State: Bullish Conviction, Bearish Conviction, Exhaustion, or Neutral.
- Action Guidance: Bullish/Bearish Cross, Hold, or Wait.
- Pressure Score: Composite value (-100 to 100).
- Agreement Percentage: Confluence strength between internal components.
For discretionary traders, this offers fast contextual analysis. For systematic traders, it provides structured rule inputs for automated trading strategies.
Indicator Settings & Customization
The Trend Pressure Prism includes flexible configuration options for adapting to different markets and timeframes.
Calculation Settings
- Lookback Period: Defines the analysis window for momentum, EMA structure, and range.
- Prism Sensitivity: Controls responsiveness to price movement.
- Min Signal RVOL: Sets the minimum volume threshold (e.g., 1.2 = 20% above average).
- Min Signal Agreement: Requires a minimum confluence level (0.0–1.0) for signal plotting.
These parameters allow optimization for stocks, crypto, forex, or futures markets.
Visual Settings
- Prism Opacity: Adjusts ribbon and glow transparency.
- Enable Dashboard: Toggle on-screen summary panel.
- Position & Size Controls: Customize dashboard layout to fit your charting workflow.
Why Use the Trend Pressure Prism in Your Trading Strategy?
Most trading indicators focus on a single dimension—momentum, volume, or moving averages. The Trend Pressure Prism merges all three into a unified, interpretable framework.
Key benefits:
- Quantified trend strength (-100 to 100 scale)
- Built-in confluence measurement (Agreement %)
- Volume-backed breakout validation
- Clear exhaustion detection
- Structured crossover signals
- Suitable for discretionary and systematic traders
Whether you trade breakouts, pullbacks, or regime shifts, this indicator provides a comprehensive market pressure model to improve trade selection and risk management.
Frequently Asked Questions
What type of trader is the Trend Pressure Prism best for?
It works for day traders, swing traders, and systematic traders who want a structured, multi-factor trend indicator with built-in volume confirmation and confluence filtering.
Does the indicator repaint?
Signals are generated using confirmed bar data and filtered conditions, making it suitable for backtesting and live trading environments.
How do I access the Trend Pressure Prism indicator?
You can get access on the LuxAlgo Library for charting platforms like TradingView, MetaTrader (MT4/MT5), and NinjaTrader for free.
Can it be used as a complete trading strategy?
Yes. With its composite pressure scoring, agreement filter, and volume validation, it can function as a standalone trading strategy or as a confirmation layer within a broader system.
Trading & investing are risky and many will lose money in connection with trading and investing activities. All content on this site is not intended to, and should not be, construed as financial advice. Decisions to buy, sell, hold or trade in securities, commodities and other investments involve risk and are best made based on the advice of qualified financial professionals. Past performance does not guarantee future results.
Hypothetical or Simulated performance results have certain limitations. Unlike an actual performance record, simulated results do not represent actual trading. Also, since the trades have not been executed, the results may have under-or-over compensated for the impact, if any, of certain market factors, including, but not limited to, lack of liquidity. Simulated trading programs in general are designed with the benefit of hindsight, and are based on historical information. No representation is being made that any account will or is likely to achieve profit or losses similar to those shown.
Testimonials appearing on this website may not be representative of other clients or customers and is not a guarantee of future performance or success.
As a provider of technical analysis tools and strategies, we do not have access to the personal trading accounts or brokerage statements of our customers. As a result, we have no reason to believe our customers perform better or worse than traders as a whole based on any content, tool, or platform feature we provide.
Charts used on this site are by TradingView in which the majority of our technical indicators are built on. TradingView® is a registered trademark of TradingView, Inc. www.TradingView.com TradingView® has no affiliation with the owner, developer, or provider of the Services described herein.
Market data is provided by CBOE, CME Group, BarChart, Massive, CoinAPI. Select U.S. equities data is provided through Massive. CBOE BZX real-time U.S. equities data is licensed from CBOE and provided through BarChart. Real-time futures data is licensed from CME Group and provided through BarChart. Select cryptocurrency data, including major coins, is provided through CoinAPI. All data is provided “as is” and should be verified independently for trading purposes.
This does not represent our full Disclaimer. Please read our full disclaimer.
© 2026 LuxAlgo Global, LLC.