Ulcer Index
 By LuxAlgoApr 11, 2026
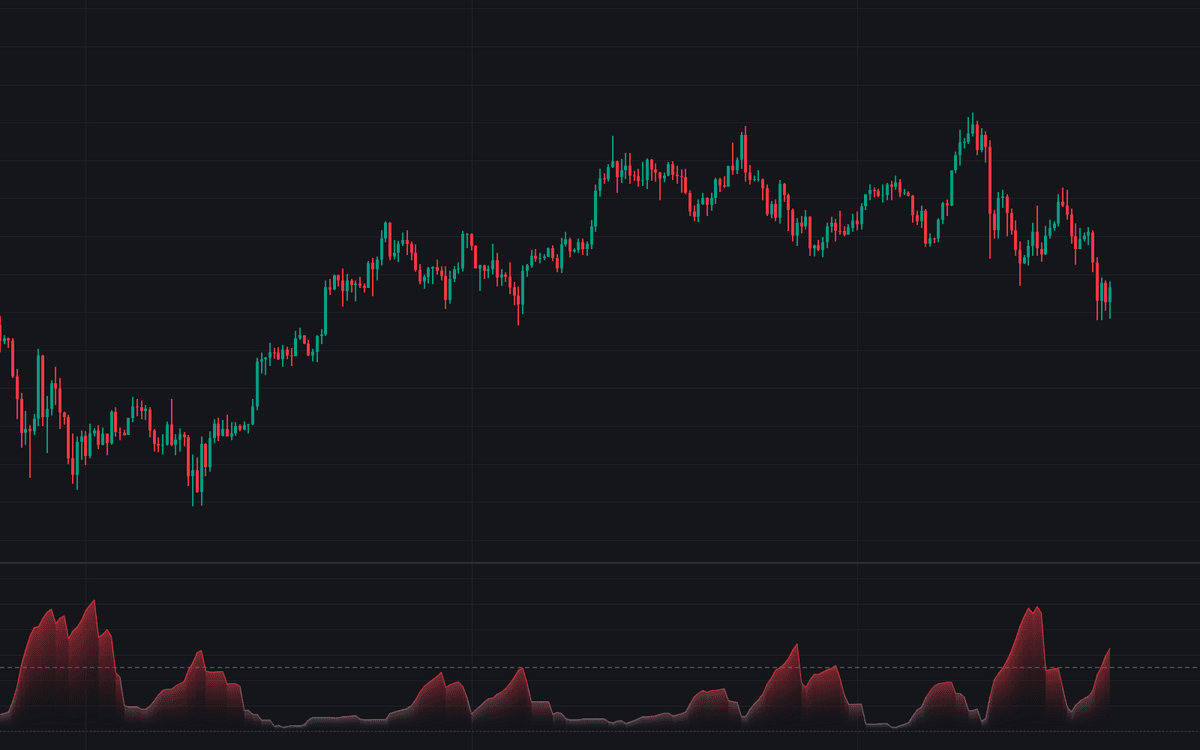

Ulcer Index turns drawdown pain into a single plotted number, the library's first faithful build of the classic construction. Across a rolling window, each bar's percentage decline from the window's running high is squared, the squares averaged and the result rooted, so both how deep and how long price sits underwater feed the reading. The Ulcer Index line rises over a gradient fill anchored at zero, a dashed line marks the alert threshold, and an optional column plot exposes the raw drawdowns being averaged.
How to Trade the Ulcer Index?
- Rising line: drawdowns are deepening, lengthening or both. Holding stress is building even when individual bars bounce.
- Threshold crosses: crossing above the dashed Alert Threshold flags elevated drawdown stress, crossing back below flags easing; both directions carry alerts.
- Drawdown % columns: the optional plot shows the current decline from the window high (zero at fresh highs, negative below them), and the Drawdown Started and Lookback High Reclaimed alerts fire on exactly those transitions.
Readings are always positive: this is a risk meter, not a direction signal.
Ulcer Index Settings
- Length (default 14): the lookback window. Short windows track tactical stress; fund-style analysis runs far longer ones.
- Source (default close): the series the drawdowns are measured on.
- Alert Threshold (default 5.0): the dashed reference level. Readings scale with the instrument and the window, so set the level against the symbol's own history.
- Style: Gradient Fill (default on) and Drawdown % (default off) toggle the optional layers.
Frequently Asked Questions

Original indicatorBuilt in-house by LuxAlgo
The Library is free. Quant makes it yours.
Pull any concept or indicator into Quant: rebuild it, retune it, or turn it into a backtested strategy of your own.