Concept
Ulcer Index
Ulcer Index is a Volatility concept. The Library holds 1 implementation, a working definition you can pull into Quant.
Top Ulcer Index indicator
The top custom implementation, built on the original standard Ulcer Index formula.
1 total
Want to trade Ulcer Index? The implementation below is one prompt away from a backtested strategy in Quant.
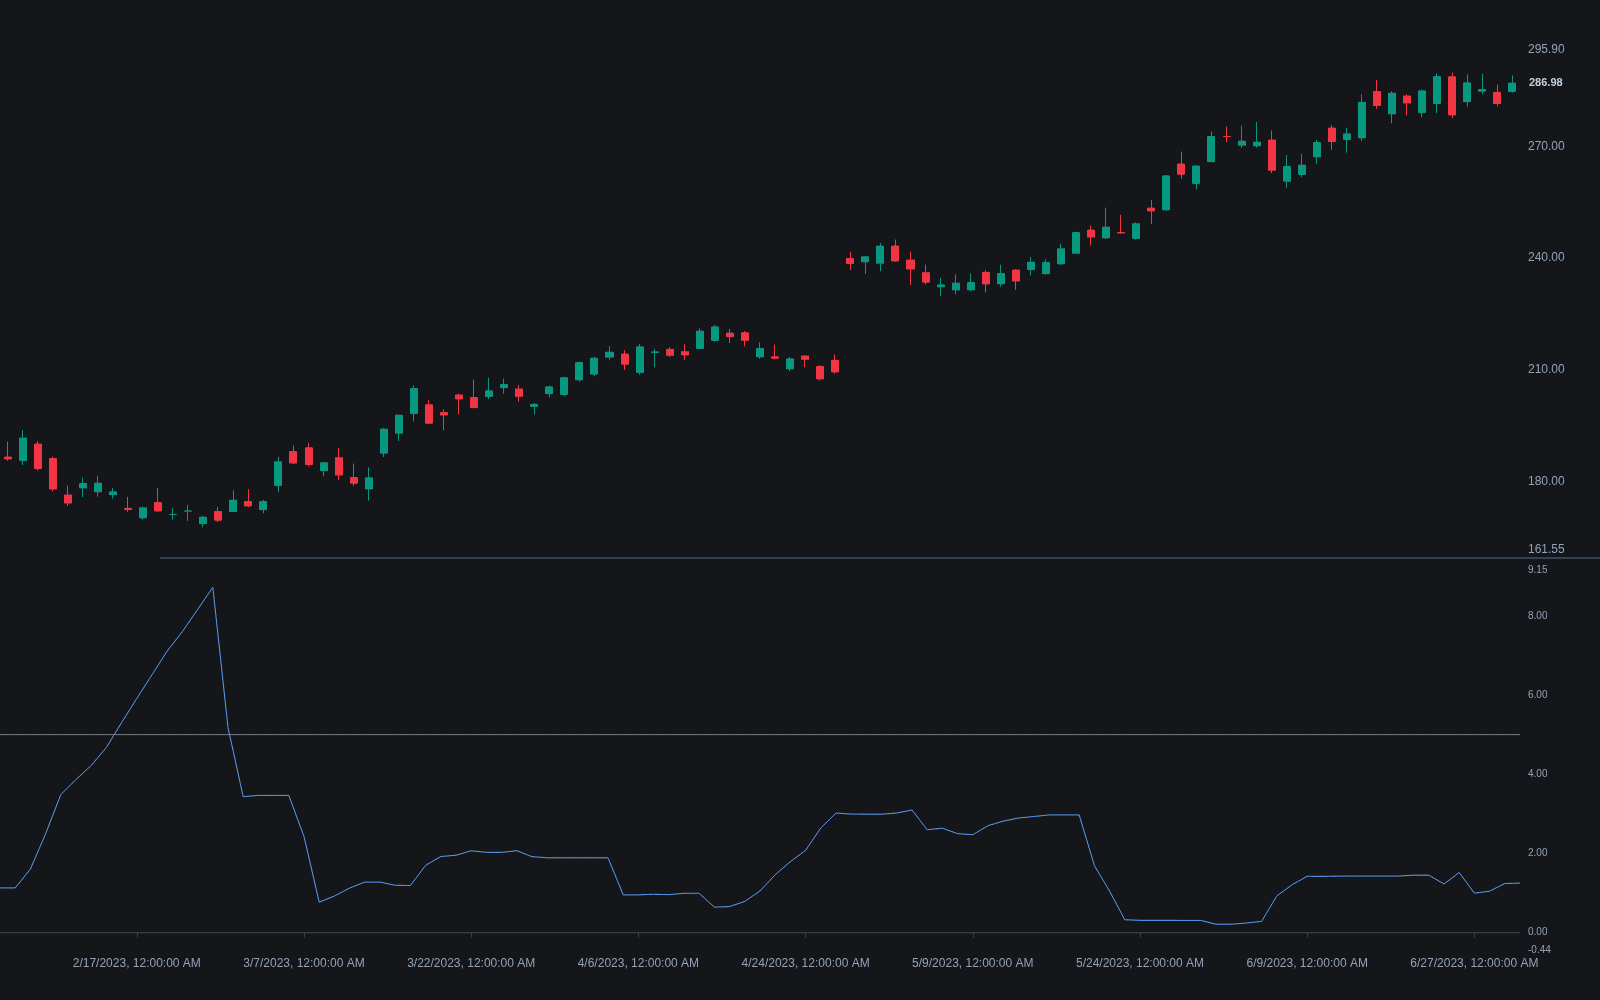
What is the Ulcer Index?
The Ulcer Index is a downside-risk measure developed in the late 1980s by Peter Martin and Byron McCann, published in their 1989 book The Investor's Guide to Fidelity Funds. Instead of treating all variability as risk, it measures only drawdown: at each bar it records the percentage decline from the highest price in the lookback, squares those declines, averages them, and takes the square root. The name is deliberate; it quantifies the stress of watching a position sit underwater.
Two design choices give it character. Squaring the drawdowns penalizes depth disproportionately, so one 20 percent decline hurts the index far more than four separate 5 percent dips. And because the drawdown persists at every bar until price reclaims its high, duration is penalized too: a market that falls and recovers quickly scores better than one that falls the same amount and grinds sideways below the high for months.
Traders and fund analysts care because standard deviation treats upside surges as risk, which contradicts how most investors experience risk. The Ulcer Index only rises when equity is below a prior peak, making it a natural denominator for risk-adjusted return: the Martin ratio, also called the Ulcer Performance Index, is excess return divided by the Ulcer Index.
How it's calculated
The root mean square of percentage drawdowns from the running maximum over the lookback.
Squaring makes the sign of D_i irrelevant; some write D_i as a positive drawdown percentage with identical results.
Applied to an equity curve rather than a price series, the same formula measures strategy pain and feeds the Martin ratio.
How traders use it
- Comparing funds and strategies: at similar returns, the investment with the lower Ulcer Index delivered them with shallower or shorter drawdowns, which is usually what an investor actually wants ranked, and the Martin ratio formalizes that comparison.
- Evaluating trading systems: computed on the equity curve, the Ulcer Index summarizes the depth-times-duration pain that a simple maximum-drawdown number, which sees only the single worst dip, understates; it pairs naturally with fuller drawdown statistics.
- As a chart study: a rising Ulcer Index on an instrument flags persistent trading below highs, a regime where trend-following longs have been suffering, though as a trailing measure it says little about what comes next.
- Its limitations: it is long-biased as usually computed (drawdown from highs is the pain of a long holder, not a short), it is entirely backward-looking, and short lookbacks make it jumpy around every local high.
Ulcer Index vs other risk measures
Standard Deviation: Standard deviation of returns is symmetric: a sharp rally raises it exactly like a sharp selloff. The Ulcer Index registers nothing while price makes new highs and only accumulates below them.
Sortino Ratio: Sortino also focuses on the downside, but through the deviation of negative returns bar by bar, with no memory of the running peak. The Ulcer Index tracks drawdown paths, so it uniquely punishes time spent underwater.
Sharpe Ratio: Sharpe divides excess return by total volatility; the Martin ratio swaps the denominator for the Ulcer Index. Two funds with identical Sharpe ratios can have very different Martin ratios if one took its losses as long, deep drawdowns.
Concept family
Volatility
57 concepts mapped · 57 in the Library
Ulcer Index FAQ
Turn Ulcer Index into a trading strategy.
Take the implementation from this page into Quant, then build on it, backtest it on real data, and keep refining it in conversation.