Ultimate Opening Range Breakout
![]() By LuxAlgoApr 8, 2026
By LuxAlgoApr 8, 2026
The Ultimate Opening Range Breakout trading indicator is an all-in-one breakout trading strategy tool built for traders who want to capture momentum after the market open with more structure and confidence. It helps define an opening range, detect breakout signals, analyze breakout quality with volume, manage trades with an ATR trailing stop, and review historical performance through a built-in dashboard. For traders looking for an opening range breakout indicator with target projections, session-based logic, and trade management features, this tool brings the full workflow into one chart.
How to Trade the Ultimate Opening Range Breakout Indicator
The indicator is built around one of the most popular intraday trading concepts: the Opening Range Breakout (ORB). It tracks the high and low of a user-defined session, such as the first 30 minutes after the New York open, and then maps the market’s movement once price escapes that range.
This gives traders a clear structure for identifying:
- breakout entries above resistance or below support
- projected expansion targets based on the opening range size
- likely momentum continuation zones
- trade management levels through a dynamic stop system
Instead of manually drawing levels every day, the indicator automates the process and turns the opening session into a complete trading framework.
Breakout Signals With Volume Confirmation
When price breaks above the opening range high, the indicator prints a BULL BREAK signal. When price breaks below the opening range low, it prints a BEAR BREAK signal. These breakout labels also include a volume qualifier so traders can quickly judge whether the move is backed by meaningful participation.
- (HV): High Volume breakout, where current volume is above the 20-period average
- (LV): Low Volume breakout, which may suggest weaker conviction or a higher chance of failure
This added context is useful because not every breakout is created equal. A strong opening range breakout with rising volume often signals real market interest, while a low-volume breakout may be more vulnerable to reversal or fakeout behavior.
Expansion Targets for Profit Planning
After the range is established, the script projects extension levels beyond the opening range. These can be used as logical areas for:
- take-profit planning
- partial exits
- measuring breakout strength
- comparing current sessions to historical behavior
Because these levels are based on the actual size of the opening range, they adapt naturally to changing volatility conditions and help traders set more realistic expectations for the day.
ATR Trailing Stop for Trade Management
The indicator also includes a dynamic ATR trailing stop, which can be enabled to manage open trades after a breakout occurs. This is especially useful for traders who want a systematic way to stay in strong moves while still protecting profits.
An ATR-based stop adjusts to volatility, which makes it more flexible than a fixed-tick or fixed-dollar stop. In faster conditions it allows more breathing room, and in calmer conditions it tightens naturally. This helps the indicator function not only as a breakout scanner, but also as a practical risk management tool.
Stop Optimizer for Strategy Refinement
One of the most advanced parts of this trading indicator is the built-in Stop Optimizer. Instead of forcing traders to guess which ATR multiplier works best, the script simulates five different trailing stop settings in the background and evaluates which one would have produced the strongest cumulative historical result.
This feature can help traders:
- fine-tune their breakout trading strategy
- compare more aggressive vs. more conservative stop behavior
- reduce guesswork during indicator setup
- adapt the tool to different markets and timeframes
For traders testing an opening range breakout strategy, this adds a valuable optimization layer without requiring separate backtesting software.
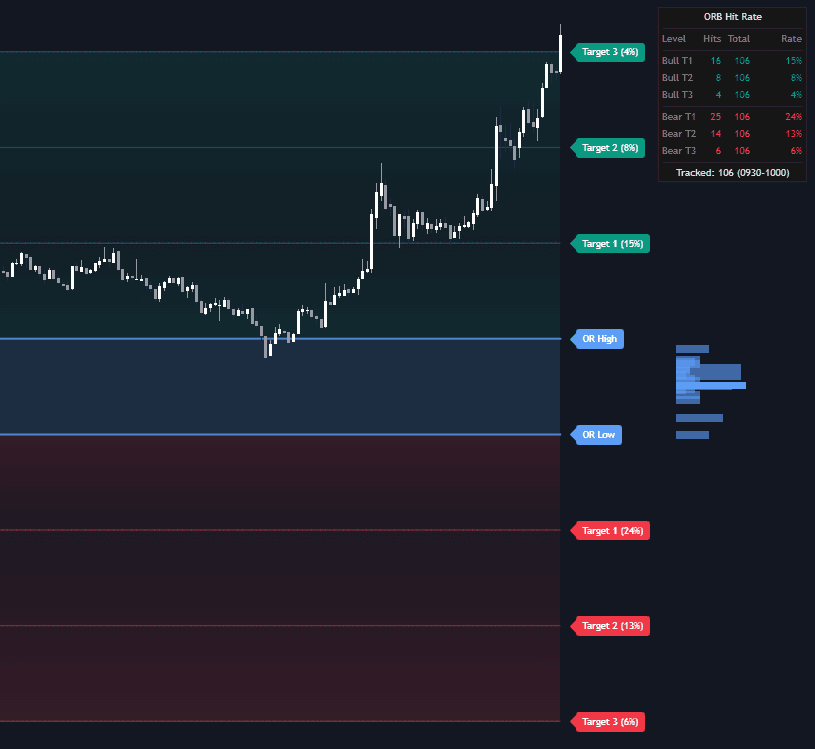
Hit Rate Dashboard for Probability Awareness
The integrated dashboard tracks how often price reaches each projected expansion level. It calculates the Hit Rate for targets such as Target 1, Target 2, and Target 3, so traders can quickly understand how often those objectives have been achieved historically.
This helps answer practical questions like:
- How often does price reach the first target after a breakout?
- Is Target 2 realistic for this market?
- Are extended moves common, or should profits be taken earlier?
By combining live signals with historical target statistics, the indicator supports more informed trade planning and helps traders align expectations with actual market behavior.
Why This Opening Range Breakout Trading Indicator Stands Out
Most opening range indicators stop at plotting the high and low of the session. The Ultimate Opening Range Breakout goes much further by combining breakout detection, volume analysis, target projection, trailing stop logic, and performance analytics in one system.
This makes it useful for:
- day traders looking for clean morning breakout setups
- momentum traders seeking confirmation through volume
- systematic traders who want optimization and statistics
- discretionary traders who want better context around session structure
Rather than acting as a single-purpose overlay, it behaves more like a complete opening range breakout trading toolkit.
Opening Range Volume Profile (ORVP)
A key differentiator is the built-in Opening Range Volume Profile (ORVP). Instead of only showing the range boundaries, the indicator also analyzes how volume was distributed inside the opening range itself.
This reveals where the most significant trading activity occurred before the breakout and highlights the Point of Control (POC), which is the price level that attracted the most volume during the opening session.
For traders, this can provide valuable insight into:
- where market participants were most active
- potential areas of acceptance or rejection
- whether the breakout is leaving behind a meaningful value zone
- how price is behaving relative to the most heavily traded part of the range
This adds a market profile element to the breakout strategy and gives traders more context than a simple high-low range box.
Why the POC Matters Before a Breakout
The Point of Control inside the opening range can act as a key reference area. If price breaks out and holds away from the POC, it may suggest conviction and directional acceptance. If price quickly returns to that high-volume area, it may indicate indecision or a failed breakout attempt.
For traders using opening range strategies, this can improve trade filtering by adding a volume-based structure layer before committing to a setup.
Adaptive Scaling for Any Market
The Volume Profile uses adaptive scaling based on the Average True Range (ATR) to determine its internal price buckets. This is important because it keeps the profile visually useful across different instruments.
Whether you trade:
- major stock indices
- large-cap equities
- forex pairs
- futures contracts
- lower-priced stocks
the profile remains proportionate and readable. This makes the indicator more versatile and prevents the profile from becoming distorted when switching between assets with very different price behavior.
Best Settings for the Ultimate Opening Range Breakout Indicator
The indicator includes a wide range of customization options so traders can tailor it to their market, trading session, and strategy preferences.
Session Settings
Opening Range Session
Use this setting to define the exact time window that forms the opening range. A common example is 0930-1000 for the first 30 minutes of the New York session, but traders can customize it for other exchanges and trading styles.
Timezone
This lets you align the opening range with your preferred local or exchange timezone. It is especially helpful for traders working across U.S., European, or global markets.
Calculation Settings
Range Source
Choose whether the opening range is based on High/Low values or Close values. High/Low is more traditional for breakout trading, while Close-based logic may appeal to traders who want a stricter confirmation method.
Extension Type
Switch between projected targets using standard Multiples or Fibonacci levels such as 0.382, 0.618, and 1.0. This gives traders flexibility depending on whether they prefer classic measured-move logic or Fibonacci-based target planning.
Volume Profile Settings
Number of Rows
This controls the vertical detail of the Opening Range Volume Profile. More rows give finer precision, while fewer rows create a broader and cleaner view.
Profile Width
This determines how far the profile extends horizontally from the opening range. Traders can use this to balance chart clarity with visual emphasis.
Trailing Stop and Optimization Settings
ATR Multiplier
This controls the sensitivity of the active trailing stop. Lower values keep the stop tighter and may lock in profits faster, while higher values provide more room for volatile trends to continue.
Show Stop Optimizer
Enable this setting to run the internal stop comparison engine and identify which ATR multiplier has produced the strongest historical performance.
Plotting Duration Settings
End Plotting At
This setting allows you to stop drawing levels at chosen market closes such as New York, London, or a manually defined time. It helps keep charts clean and focused once the main trading session is over.
Who Should Use This Trading Strategy Indicator?
The Ultimate Opening Range Breakout indicator is well suited for traders who want to build or improve an opening range breakout trading strategy with more data and structure.
It can be especially useful for:
- intraday traders focused on the market open
- breakout traders who need volume confirmation
- traders who want projected price targets automatically drawn
- users who prefer rule-based trailing stop management
- traders who want historical target hit rates without manual journaling
Because it combines signal generation, market context, and trade management, it works well as both a standalone trading indicator and as part of a broader discretionary or systematic strategy.
FAQ
What is the Ultimate Opening Range Breakout indicator?
It is an opening range breakout trading indicator that marks a user-defined session high and low, detects bullish and bearish breakouts, adds volume confirmation, projects price targets, includes an ATR trailing stop, and tracks target hit rates through a dashboard.
How does this opening range breakout trading strategy help traders?
It helps traders structure the market open by turning the first session range into a clear framework for entries, targets, and stop management. This can make breakout trading more objective and easier to repeat.
What does HV or LV mean on breakout signals?
HV means the breakout happened on high volume relative to the 20-period average, while LV means the breakout occurred on lower volume and may have less conviction behind it.
Why is the Opening Range Volume Profile useful?
It shows how volume was distributed inside the opening range before the breakout and highlights the Point of Control. This helps traders understand where the most important positioning took place before price moved.
Can I use this indicator on different assets?
Yes. The adaptive scaling and flexible session settings make it suitable for a wide range of instruments, including stocks, indices, forex, and futures, depending on your platform and market hours.
How do I access the Ultimate Opening Range Breakout indicator?
You can get access on the LuxAlgo Library for charting platforms like TradingView, MetaTrader (MT4/MT5), and NinjaTrader for free.
Free indicator
Get free access to this indicator on the platforms below.
Unlock the entire LuxAlgo Library
Every indicator, every strategy, full charts, and complete access to Quant — our AI agent.