Unreached Highs/Lows Oscillator
![]() By LuxAlgoJan 21, 2026
By LuxAlgoJan 21, 2026
The Unreached Highs/Lows Oscillator is a momentum-based trading indicator that measures how many price highs or lows remain unretested over time, expressed as a percentage. By tracking these unreached levels, the oscillator helps traders clearly identify trend strength, directional bias, and shifts in market participation between bullish and bearish traders. It is especially useful as both a trading indicator and a complementary trading strategy tool when combined with price action and trend analysis.
USAGE
This trading indicator is designed to visualize the strength of directional price movement by quantifying how aggressively one side of the market is in control. Strong trends tend to leave price levels behind, while weak or ranging markets frequently revisit prior highs and lows.
- In a strong bullish trend, price continues to push higher without revisiting previous lows. As a result, unreached lows accumulate, signaling sustained buying pressure.
- In a strong bearish trend, price continues lower without revisiting previous highs. This leads to an increase in unreached highs, signaling persistent selling pressure.
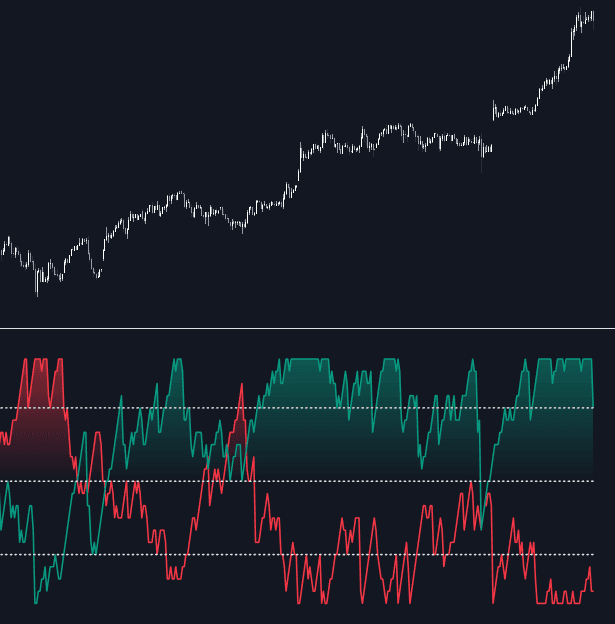
High readings of unreached highs (red) combined with low readings of unreached lows (green) are considered bearish, especially when confirmed by a downtrend in price. Conversely, high readings of unreached lows and low readings of unreached highs are considered bullish, typically aligning with an uptrend.
Because the oscillator is normalized, it also includes predefined overbought and oversold levels, making it easier to interpret momentum exhaustion and continuation zones.
The Unreached Highs/Lows Oscillator can also be used to identify breakouts. A rapid decrease in unreached highs or lows suggests that price is aggressively reclaiming previous levels, often signaling strong momentum expansion or a regime shift in market structure.
In this gold chart example, the oscillator is combined with price behavior to illustrate different market environments:
- 1. Uptrend: Bullish readings remain above 80 while bearish readings stay below 20, confirming a strong bullish trend.
- 2. Range: Both bullish and bearish readings fluctuate around 50, indicating a sideways market.
- 3. Uptrend: Bullish readings again hold above 80 with bearish below 20, confirming trend continuation.
- 4. Pullback: Bullish readings dip from above 80 toward 50, while bearish remains below 20, signaling a corrective move within an uptrend.
- 5. Range: Mixed readings above and below thresholds reflect consolidation and indecision.
- 6. Uptrend: Bullish dominance resumes with readings above 80 and bearish below 20.
- 7. Pullback: Bullish dips and bearish rises toward 50 suggest another corrective phase.
- 8. Uptrend: Bullish readings regain strength above 80, confirming continued upside momentum.
This Bitcoin example demonstrates how extreme readings can be used to detect potential reversals. When both bullish and bearish values reach opposite extremes (0 and 100), traders can adjust the threshold levels from the default 80/20 to 100/0 to better isolate these conditions.
- Extreme readings at points 1 and 5 highlight major reversals that lead to sustained trend changes.
- Extreme readings at points 2, 3, 4, and 6 indicate minor reversals that occur within the existing trend structure.
This makes the Unreached Highs/Lows Oscillator a powerful trading indicator for distinguishing between meaningful reversals and temporary pullbacks.
From the settings panel, traders can fine-tune the Length parameter to adapt the indicator to different trading styles and timeframes. Shorter lengths react faster to small price movements, while longer lengths smooth the data and focus on larger-scale trends. A default length of 20 provides a balanced view for most market conditions.
The chart above illustrates how adjusting the length affects the sensitivity of both bullish and bearish measurements.
SETTINGS
- Length: Defines the maximum number of highs and lows used in the calculation. Smaller values increase sensitivity; larger values emphasize broader trends.
Style
- Bullish: Customize the color used for unreached lows.
- Bearish: Customize the color used for unreached highs.
- Top Threshold: Set the upper threshold level and color. Enable Auto to use the default styling.
- Bottom Threshold: Set the lower threshold level and color. Enable Auto to use the default styling.
FAQ
What type of trading strategy is the Unreached Highs/Lows Oscillator best suited for?
This trading indicator works well for trend-following strategies, momentum confirmation, breakout detection, and identifying pullbacks within strong trends.
Can this indicator be used for reversals?
Yes. Extreme readings near 0 and 100 can highlight potential reversal zones, especially when combined with price action and market structure analysis.
How do I access the Unreached Highs/Lows Oscillator?
You can get access on the LuxAlgo Library for charting platforms like TradingView, MetaTrader (MT4/MT5), and NinjaTrader for free.
Free indicator
Get free access to this indicator on the platforms below.
Unlock the entire LuxAlgo Library
Every indicator, every strategy, full charts, and complete access to Quant — our AI agent.