Value Area Reversion Signals
 By LuxAlgoAug 18, 2026
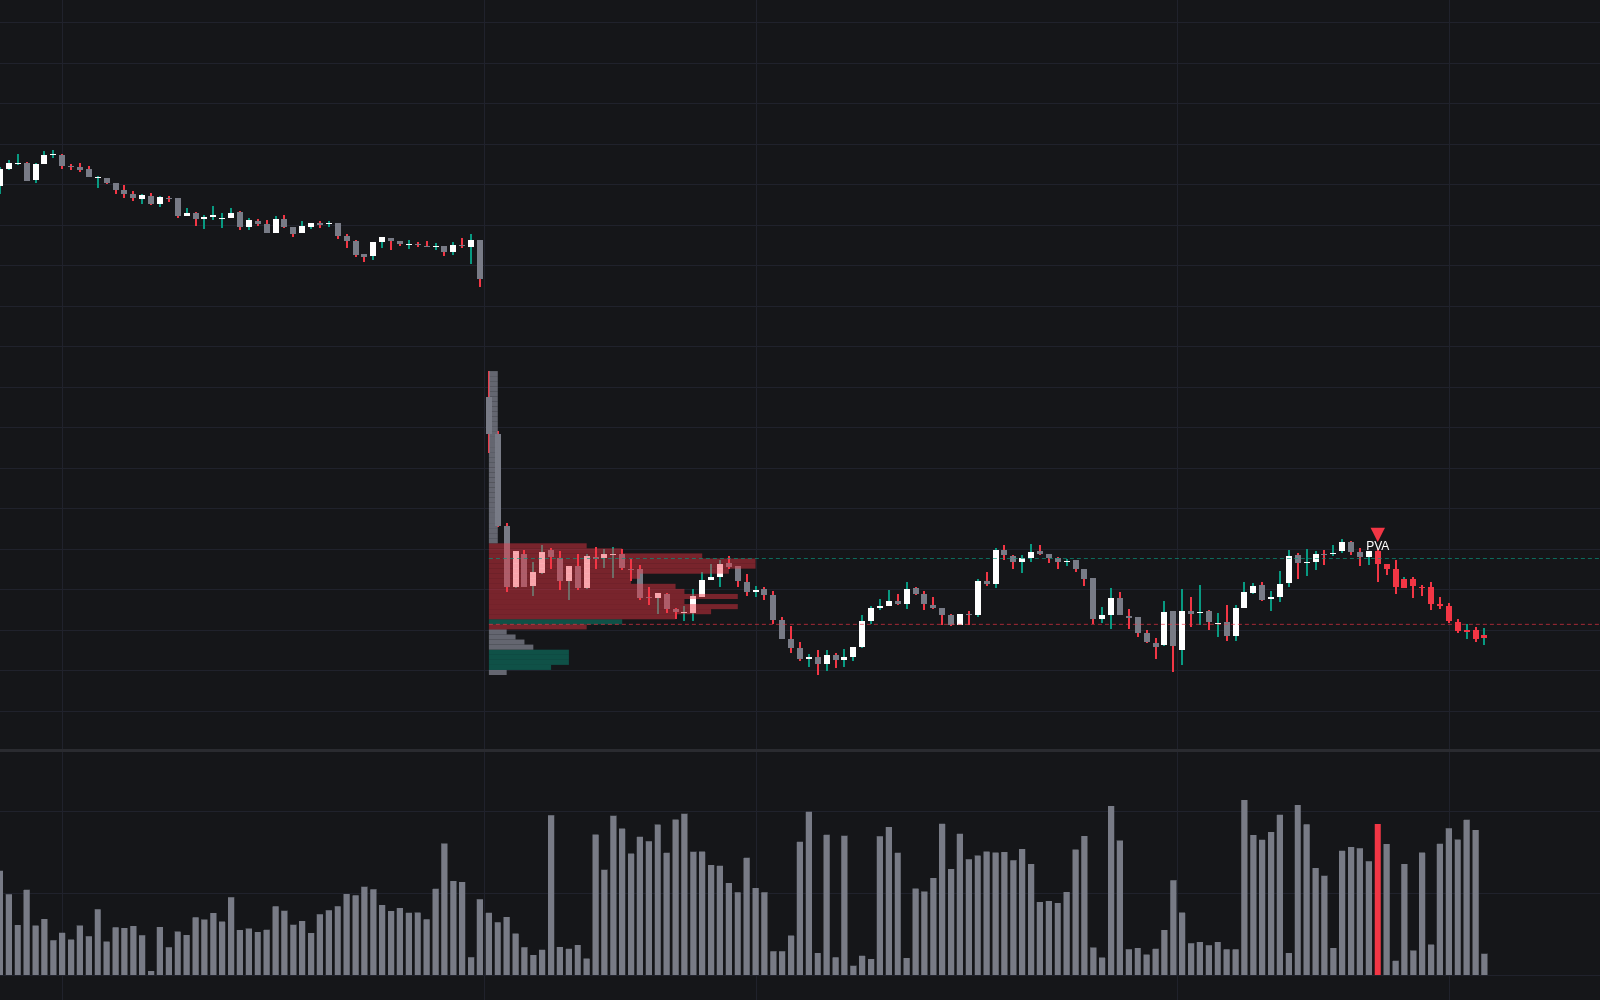

Value Area Reversion Signals is a technical analysis tool that leverages anchored volume profile data to identify high-probability mean reversion opportunities. By monitoring price behavior relative to the Value Area, the indicator highlights instances where an asset experiences a failed breakout and subsequently reclaims its area of high volume with confirming directional momentum. This approach helps traders detect exhaustion in price trends and potential reversals, providing a systematic way to capitalize on range-bound or mean-reverting market conditions using objective volume-based levels.
How to Trade the Value Area Reversion Signals?
The primary objective of this indicator is to identify "reclaims" of the Value Area, which often signal that a breakout was unsustainable and that price is returning to its fair value. A bullish reclaim signal occurs when the price drops below the Value Area Low, struggles to maintain momentum, and then produces a bullish engulfing candle that re-enters the Value Area with expanding volume. Conversely, a bearish reclaim signal occurs when the price breaks above the Value Area High, fails to hold the level, and subsequently falls back inside the Value Area with strong bearish volume.
Traders should monitor the labeled signals (PVA for previous day, CVA for current day) as confirmation of a potential trend reversal. Because these signals require specific volume expansion conditions, they act as a filter against fakeouts. It is often effective to combine these signals with existing horizontal support or resistance levels. If a reclaim occurs near the Point of Control, it may indicate a strong attraction back toward the center of the trading range, further validating the reversal setup.
Value Area Reversion Signals Settings
Profile
- Rows: Defines the granularity of the anchored volume profile by adjusting the number of price bins.
- Value area (%): Sets the percentage of total volume included in the Value Area, calculated outward from the Point of Control.
- Maximum profile width (bars): Controls the horizontal extent of the volume histogram on the chart.
- Insignificant volume threshold (%): Determines the volume level at which rows are colored as insignificant, helping to highlight high-volume nodes.
- Show profile / Show previous profile: Toggles the visibility of the anchored volume histograms for the current and prior sessions.
- Show POC: Toggles the display of the Point of Control, representing the price level with the highest traded volume.
Signals
- Show previous day signals: Enables or disables the detection of reclaim signals based on the most recently completed anchored session.
- Show current day signals: Enables or disables the detection of reclaim signals based on the live, developing session.
- Maximum bars to signal after breakout: Limits the timeframe allowed for a reclaim to occur following the initial breach of the Value Area.
Style
- VAH / VAL / POC: Customizes the colors for the Value Area High, Low, and Point of Control lines.
- Up-volume / Down-volume profile: Adjusts the color fill for bullish and bearish volume rows within the profile.
- Bullish / Bearish reclaim signal: Sets the colors for the signal markers and candles when a valid reclaim is detected.
Frequently Asked Questions
Free on Vela
Run it on Vela. Go further with a paid plan.
- Up to 500 strategy alerts, with webhook automation
- Up to 10× the chart history of Free
- Orderflow lookback up to full history
- Up to 100,000 monthly credits for Quant to customize it
- Futures data alongside crypto, stocks, forex and commodities
Also on other platforms
Get free access to this indicator elsewhere.

The Library is free. Quant makes it yours.
Pull any concept or indicator into Quant: rebuild it, retune it, or turn it into a backtested strategy of your own.