Concept
Volume Profile
Volume Profile, also known as fixed range, visible range, session, composite, is a Volume & Order Flow concept. The Library holds 30 implementations, each one a working definition you can pull into Quant.
Top Volume Profile indicators
The top custom implementations, built on the original standard Volume Profile formula.
Want to trade Volume Profile? Any of the 21 implementations below is one prompt away from a backtested strategy in Quant.
.png&w=3840&q=75)
What is a Volume Profile?
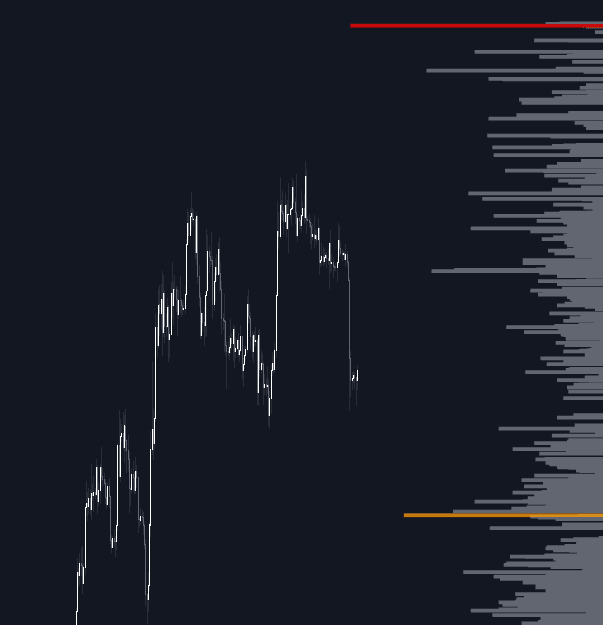
A volume profile is a histogram of traded volume organized by price instead of time. Where the volume pane under a chart answers how much traded in each bar, the profile rotates the question 90 degrees: how much traded at each price. Over any chosen window (a session, a swing, the visible chart, or a multi-week composite) every transaction is binned into the price level where it occurred, producing a sideways silhouette of where the market actually did business.
The profile's anatomy has standard names. The point of control (POC) is the single price with the most volume, the mode of the distribution. The value area is the band around it holding a set share of total volume, 70% by common convention. Bulges and thin shelves are high- and low-volume nodes: prices the market accepted and traded repeatedly versus prices it rejected or raced through.
The idea descends from Peter Steidlmayer's Market Profile work at the CBOT in the 1980s, with volume standing in for time-at-price. It matters because it grounds support and resistance in observed participation rather than pattern geometry: a level where heavy volume changed hands is a level where many positions live, and price returning there re-engages those positions. The profile describes the past, though. It ranks locations by relevance; it does not predict the reaction.
How to read a Volume Profile
Reading a profile is mostly about choosing the window deliberately and then classifying its shape.
- 1Choose the anchor. Session profiles reset daily, fixed-range profiles cover a swing or event you select, visible-range profiles follow whatever the chart shows, and composites merge many days. The profile only describes trade inside that window.
- 2Locate the point of control, the price row with the highest volume, and note whether it sits high, low, or centered within the range.
- 3Mark the value area around the POC (commonly 70% of total volume) to separate accepted prices from the tails.
- 4Classify the shape: a symmetric bell suggests balance, a double distribution records a transition between two accepted areas, and long thin tails mark rejection. Low-volume shelves between nodes are where price tends to travel fastest.
How it's calculated
A volume profile is a horizontal histogram showing how much volume traded at each price level across a chosen range of bars.
Fixed range, visible range, session, composite, and anchored profiles differ only in the range chosen in step 1.
Step 3 varies by platform: even split across the bar's span, all volume placed at one price such as the close, or exact allocation from tick data.
The two-rows-at-a-time comparison in step 6 is the classic Market Profile value area method; some implementations expand one row at a time instead.
How traders use it
- To locate support and resistance from participation: high-volume nodes and prior value-area edges serve as S/R zones chosen from evidence of past business rather than from lines drawn on wicks.
- To frame trade location and targets: entries near a node's edge are risk-defined against it, targets are projected across low-volume gaps toward the next node, and an untested prior POC (a naked POC) stays on the map as a revisit candidate. None of these levels is obligated to hold.
- To judge acceptance versus rejection: if price pushes outside the value area and keeps trading there, the market is accepting new prices, which favors continuation; a quick trip back inside marks rejection and favors rotation back across the trading range.
- To add flow context: pairing the profile with per-price aggressor data (footprint concepts) shows not just how much traded at each level but which side initiated it, which helps distinguish absorption from ordinary participation.
Volume Profile vs adjacent tools
TPO Profile: Market Profile's TPO chart counts time at price, not volume at price. The two usually agree on broad structure but diverge when a short burst transacts huge volume: TPO understates it, the volume profile shows the spike.
Delta Profile: A delta profile keeps the same price-binned layout but plots buy volume minus sell volume per level, exposing which side was aggressive there. The standard profile answers 'how much traded'; the delta profile answers 'who pushed.'
Session VWAP: VWAP compresses the session's volume-weighted trade into one average line, the mean, while the profile shows the whole distribution and its POC is the mode. The two often sit near each other but are different statistics.
Resting Liquidity / Liquidity Heatmap: A liquidity heatmap plots resting limit orders that may be pulled and may never execute: intent. A volume profile plots executed trades: history. Confusing displayed liquidity with transacted volume is a common mix-up.
More Volume Profile implementations
- Volume Profile with Node Detection
- Anchored Clusters Volume Profile
- Clusters Volume Profile
- Gaussian Volume Profile
- Swing Volume Profiles
- Temporal Volume Profile 3D
- Volume Anchored Price Map
- Supply and Demand Visible Range
- Supply and Demand Anchored
- Liquidity Sentiment Profile (Auto-Anchored)
- Liquidity Sentiment Profile
- Money Flow Profile
- Volume Grid Heatmap
- Delta Flow Profile
- KDE Value Clouds
- Structural Leg Profiler
- Supply Demand Profiles
- Volumetric Regression Heatmap
Concept family
Volume & Order Flow
88 concepts mapped · 88 in the Library
Volume Profile FAQ
Turn Volume Profile into a trading strategy.
Take any implementation from this page into Quant, then build on it, backtest it on real data, and keep refining it in conversation.