Concept
Value Area
Value Area, also known as developing VA, is a Volume & Order Flow concept. The Library holds 2 implementations, each one a working definition you can pull into Quant.
VAH/VAL
Top Value Area indicators
The top custom implementations, built on the original standard Value Area formula.
2 total
Every Value Area implementation here is strategy-ready: open one in Quant, set your rules, and it backtests automatically.
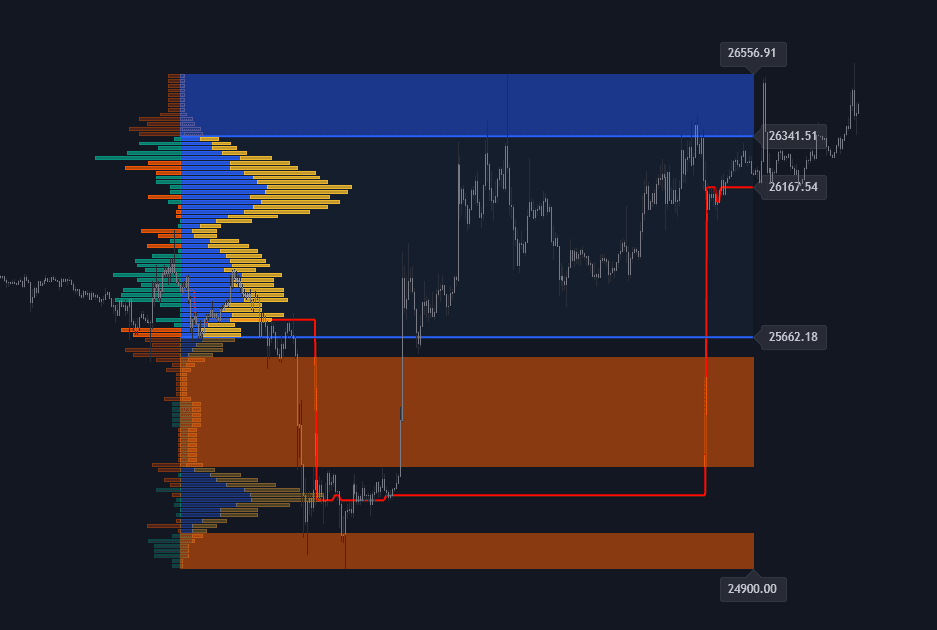
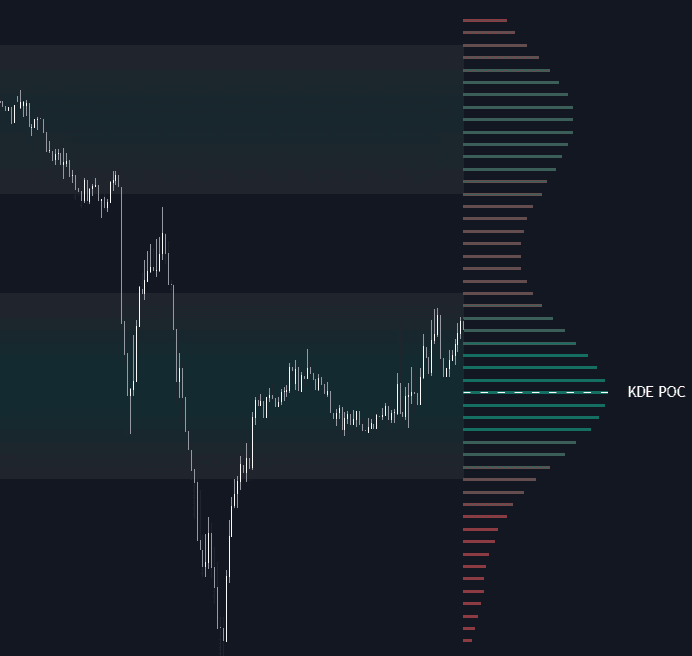
What is a Value Area?
The value area is the price band containing a set share of a period's trade, 70% by convention. It is built from a volume profile or TPO profile: starting at the point of control, the busiest price, the calculation expands outward, adding whichever adjacent level holds more activity, until the target share of total volume or TPO count is enclosed. The boundaries are the value area high (VAH) and value area low (VAL). The 70% figure is a market profile convention chosen to approximate one standard deviation of a bell-shaped distribution, which covers about 68%.
In auction terms, the value area is where the market did most of its two-sided business: the prices both buyers and sellers accepted. Trade rotating inside it signals balance; sustained trade beyond VAH or VAL signals that value may be migrating. The developing value area is the same calculation run live as the session builds, so the band shifts until the close, after which the completed value area is carried forward as a reference for later sessions. None of these boundaries are guaranteed to hold; they mark where acceptance ended last time, not where it must end next time.
How to calculate the Value Area
The standard algorithm builds the band outward from the point of control until the target share of activity is enclosed.
- 1Build a profile for the period: total traded volume (or TPO count for a time-based profile) at each price increment.
- 2Locate the point of control, the increment with the most activity; it seeds the value area.
- 3Compare the levels adjacent to the current band above and below, and add whichever side holds more activity, repeating until the band contains the target share, customarily 70%. Implementations differ on whether levels are added singly or in pairs, which shifts results slightly.
- 4Mark the band's boundaries as VAH and VAL; running the same routine bar by bar produces the developing value area.
How it's calculated
The value area is the price range around the point of control that contains a set share of the period's traded volume, typically 70%, bounded by VAH above and VAL below.
The 70% default approximates one standard deviation of a normal distribution around the mean.
Platforms differ on stepping one row or two at a time and on tie breaks, so VAH and VAL can vary slightly between tools.
Applied to TPO counts instead of volume, the same recipe gives the Market Profile value area.
How traders use it
- As responsive-trade boundaries: in balanced conditions, traders fade moves at VAH and VAL back toward the point of control, and stop doing so once price is accepted outside the band.
- For the classic 80% rule: when price opens outside the prior value area, re-enters, and holds inside for roughly two 30-minute periods, the market profile playbook targets a rotation to the opposite boundary. It is a scenario drawn from profile practice, not a measured guarantee.
- To read value migration: comparing successive sessions' value areas (higher, lower, or overlapping) is a compact way to classify trend versus balance without any indicator.
- As next-session reference levels alongside the POC and other prior-period levels, particularly for judging whether an open outside value gets accepted or rejected.
Value Area vs related concepts
Point of Control: The POC is the single price with the most activity; the value area is the band built outward from it. One is a level, the other is a zone with two tradable edges.
Volume Profile: The profile is the entire distribution of volume at price. The value area is a summary statistic of it: the central 70%. Different profile windows (session, composite, visible range) produce different value areas.
Initial Balance: The initial balance is a time bracket, customarily the session's first hour. The value area is activity-based and usually finishes shaped differently; profile traders compare how range extension beyond the IB relates to where value actually built.
Concept family
Volume & Order Flow
88 concepts mapped · 88 in the Library
Value Area FAQ
Turn Value Area into a trading strategy.
Take any implementation from this page into Quant, then build on it, backtest it on real data, and keep refining it in conversation.