Volatility Cones
 By LuxAlgoApr 27, 2026
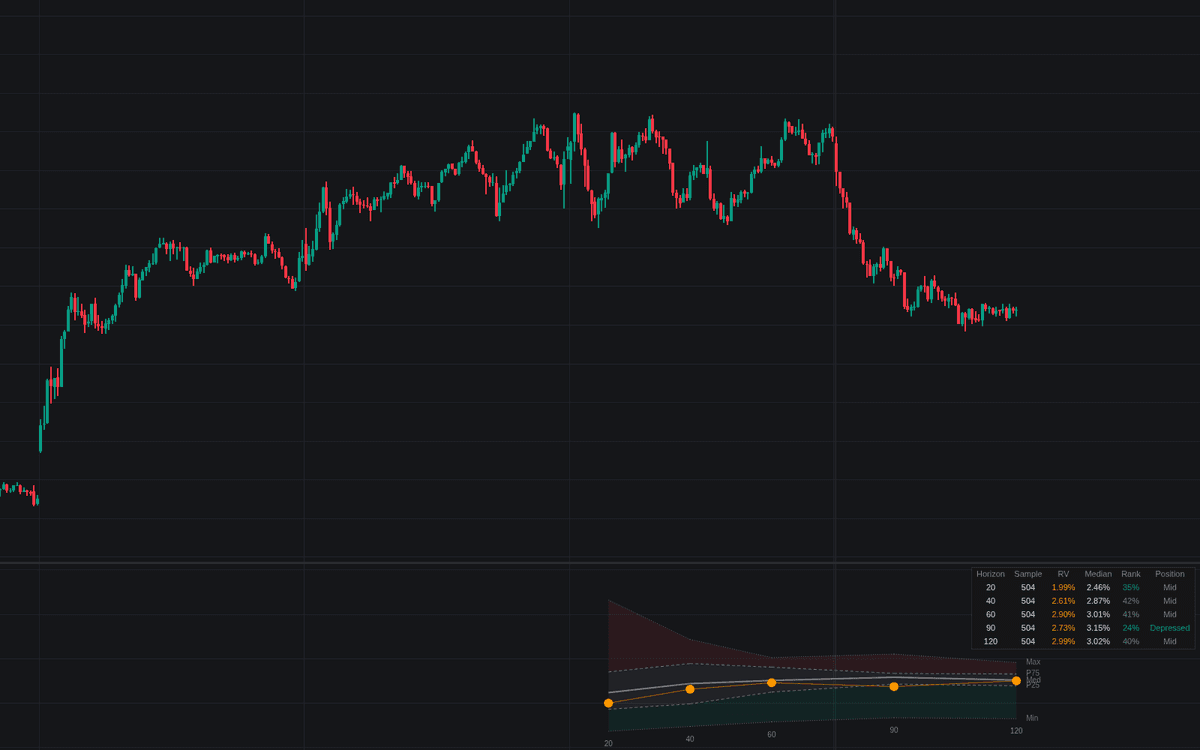

Volatility Cones places the current volatility reading in the context of what the market has done over comparable windows. Rolling realized volatility at five horizons is summarized into minimum, percentile bands, median and maximum, drawn as the classic volatility cones shape beside the last bar with each horizon's current reading marked inside. A dashboard adds sample size, cone median, percentile rank and a plain-words position per horizon.
How to Trade the Volatility Cones?
- Rich for the horizon: above the upper percentile, realized volatility is rich by that horizon's own history; the cross is alerted.
- Depressed for the horizon: below the lower percentile flags compression, with its own alert; crossing the recorded maximum or minimum adds two more.
- The profile across horizons: the connected readings show whether stress sits in short windows or across every horizon.
- Options overlay: manually entered implied volatilities plot as diamonds; near the cone top premium is historically expensive, near the floor cheap.
Volatility Cones Settings
- Horizon 1–Horizon 5 (defaults 20, 40, 60, 90, 120): one cone column each.
- Sample Length (default 504): observations kept per horizon, about two years of daily bars.
- Annualization Factor (default 252): periods per year; adjust off daily charts.
- Subtract Mean Return (default off): variance-style estimation instead of the classic zero-mean construction.
- Lower Percentile (default 25) and Upper Percentile (default 75): the drawn bands.
- Show Current Realized Volatility (on), Connect Current Readings (on), Show Implied Volatility Entries (off) with five IV @ Horizon fields (default 0).
- Display: Cone Width (bars) (default 120), Rightward Offset (bars) (default 0), Show Dashboard (on, Top Right, Small).
Frequently Asked Questions

Original indicatorBuilt in-house by LuxAlgo
The Library is free. Quant makes it yours.
Pull any concept or indicator into Quant: rebuild it, retune it, or turn it into a backtested strategy of your own.