Concept
Volatility Cones
Volatility Cones are Volatility concepts. The Library holds 1 implementation, a working definition you can pull into Quant.
Top Volatility Cones indicator
The top custom implementation, built on the original standard Volatility Cones formula.
1 total
The Volatility Cones implementation below can become a backtested trading strategy — describe your rules and Quant writes the code.
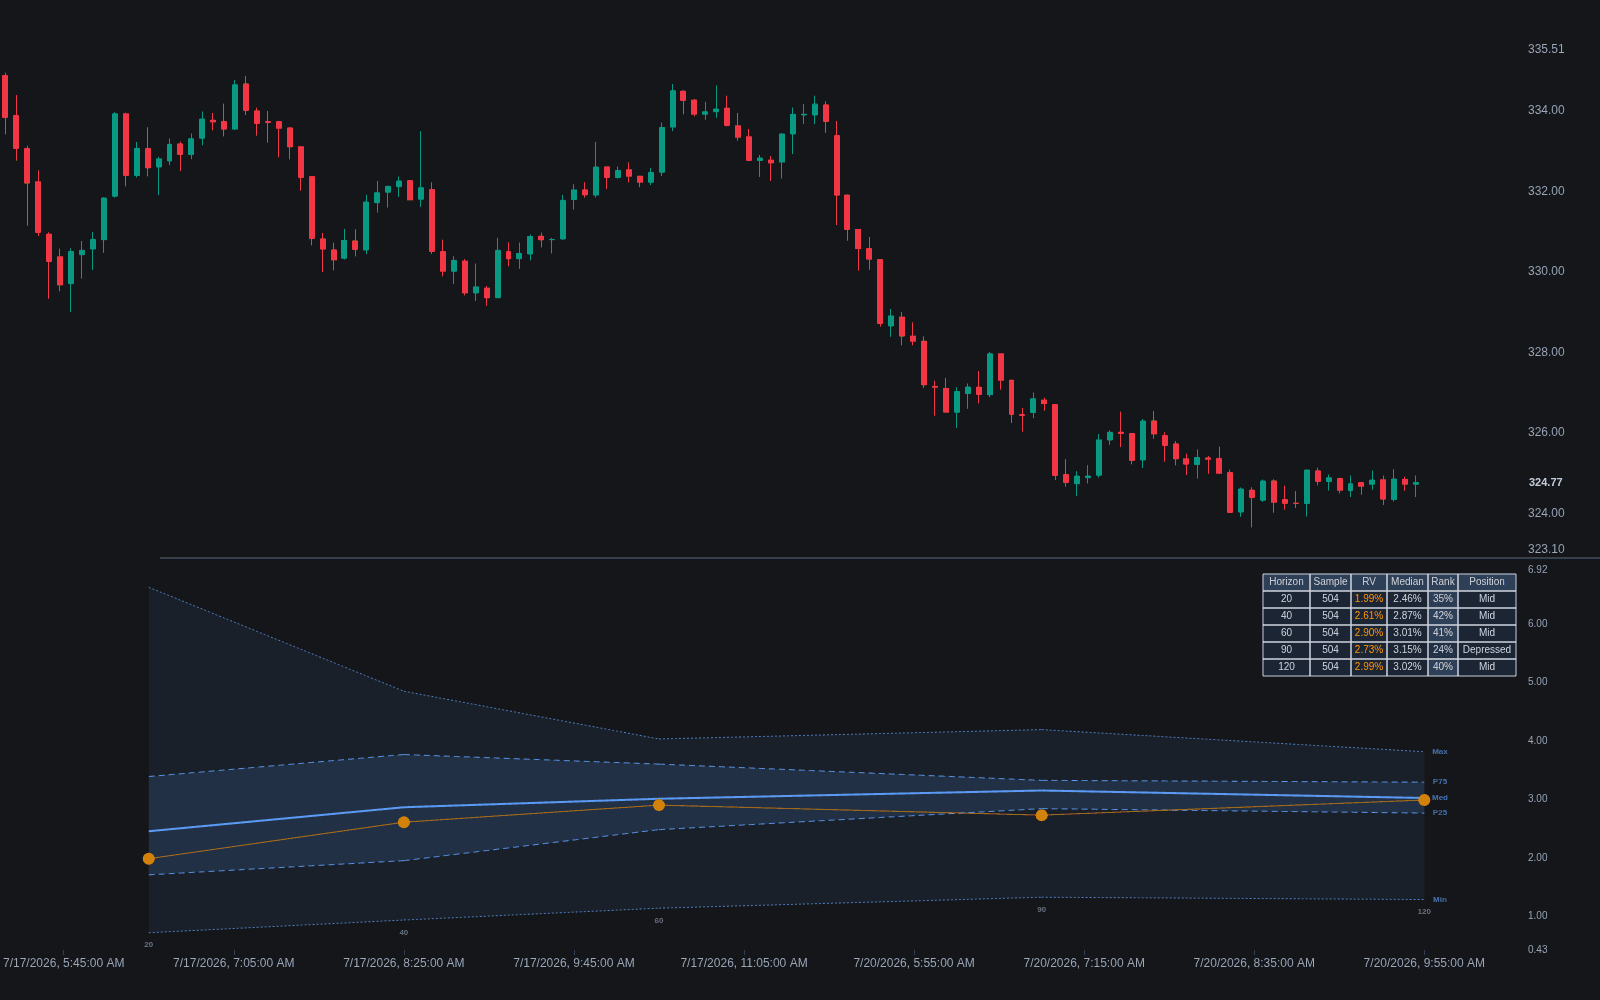
What are volatility cones?
Volatility cones are a display of how realized volatility has historically been distributed across measurement horizons. For each horizon, say 20, 40, 60, 90, and 120 trading days, you compute rolling realized volatility over several years of history and record percentiles: the minimum, lower quartile, median, upper quartile, and maximum. Plotting those percentiles against horizon produces a cone shape, wide at short horizons and narrowing as the horizon lengthens, because short-window volatility estimates swing far more than long-window ones.
The technique was introduced by Galen Burghardt and Morton Lane in their 1990 paper How to Tell if Options Are Cheap. Its purpose is context: a single volatility number means little until you know where it sits in the range of what that market has actually done over comparable windows.
The classic application overlays current implied volatility for options of matching maturities onto the cone. Implied vol near the top of the cone for its horizon is expensive relative to what realized vol has historically delivered over that span; near the bottom, cheap. Directional traders use the same chart without options, simply to judge whether current realized volatility is stretched or depressed for its window length.
How to read a volatility cone chart
The chart plots volatility on the vertical axis against measurement horizon on the horizontal, with one line per percentile.
- 1Confirm the cone shape: percentile lines should fan out at short horizons and converge at long ones, reflecting the noisier estimates of short windows.
- 2Locate the current readings: today's realized volatility for each window, and, for options work, implied volatility at each maturity, plotted as points at their horizons.
- 3Judge each point by its vertical position inside the cone: above the upper quartile is historically rich for that horizon, below the lower quartile historically depressed.
- 4Compare across horizons: implied vol sitting high in the cone at short maturities but mid-cone further out describes an event premium rather than a broad repricing, related to the shape of the volatility term structure.
- 5Check the sample: a cone built over a placid three years will make any turbulence look extreme, so know what regimes the history contains.
How it's calculated
Rolling realized volatility at several window lengths, summarized by percentiles per window.
Rolling windows overlap, which makes extreme percentiles less statistically reliable than they look; Burghardt and Lane discuss this overlap problem explicitly.
Some builders subtract the mean return inside each window or use range-based estimators from the volatility estimator family instead of close-to-close returns.
How traders use it
- Options valuation context: comparing implied volatility at each maturity to the cone percentiles for the matching horizon frames whether premium is historically rich or cheap, a starting point for buying or selling volatility rather than a complete trade case.
- Volatility mean-reversion setups: readings hugging the cone's extremes have tended to drift back toward the median over time, though they can stay extreme through an entire regime, so the cone times nothing by itself.
- Regime awareness for directional traders: knowing that current 20-day volatility sits in its bottom decile warns that stops and targets calibrated to recent movement may be too tight if conditions normalize.
- The honest caveats: cones are built from overlapping samples, they encode only the history you feed them, and implied vol can sit above the entire cone for good reason when the market prices an event the past sample never contained.
Volatility cones vs neighboring constructions
Probability Cones: Probability cones project a range of future prices forward from today using an assumed volatility. Volatility cones look backward, summarizing the historical distribution of volatility itself across horizons. One is a price forecast envelope, the other a valuation context chart.
Volatility Term Structure: The term structure is a single curve of current implied volatility across maturities. A cone supplies the historical distribution behind each point on that curve, which is what lets you call a point rich or cheap.
Volatility Percentile Rank: Percentile rank scores today's volatility against its own history at one fixed window. A cone is effectively that idea computed at many windows simultaneously and drawn as a curve family.
Concept family
Volatility
57 concepts mapped · 57 in the Library
Volatility Cones FAQ
Turn Volatility Cones into a trading strategy.
Take the implementation from this page into Quant, then build on it, backtest it on real data, and keep refining it in conversation.