Concept
Volume Zone Oscillator
Volume Zone Oscillator is a Volume & Order Flow concept. The Library holds 1 implementation, a working definition you can pull into Quant.
VZO
Top Volume Zone Oscillator indicator
The top custom implementation, built on the original standard Volume Zone Oscillator formula.
1 total
Want to trade Volume Zone Oscillator? The implementation below is one prompt away from a backtested strategy in Quant.
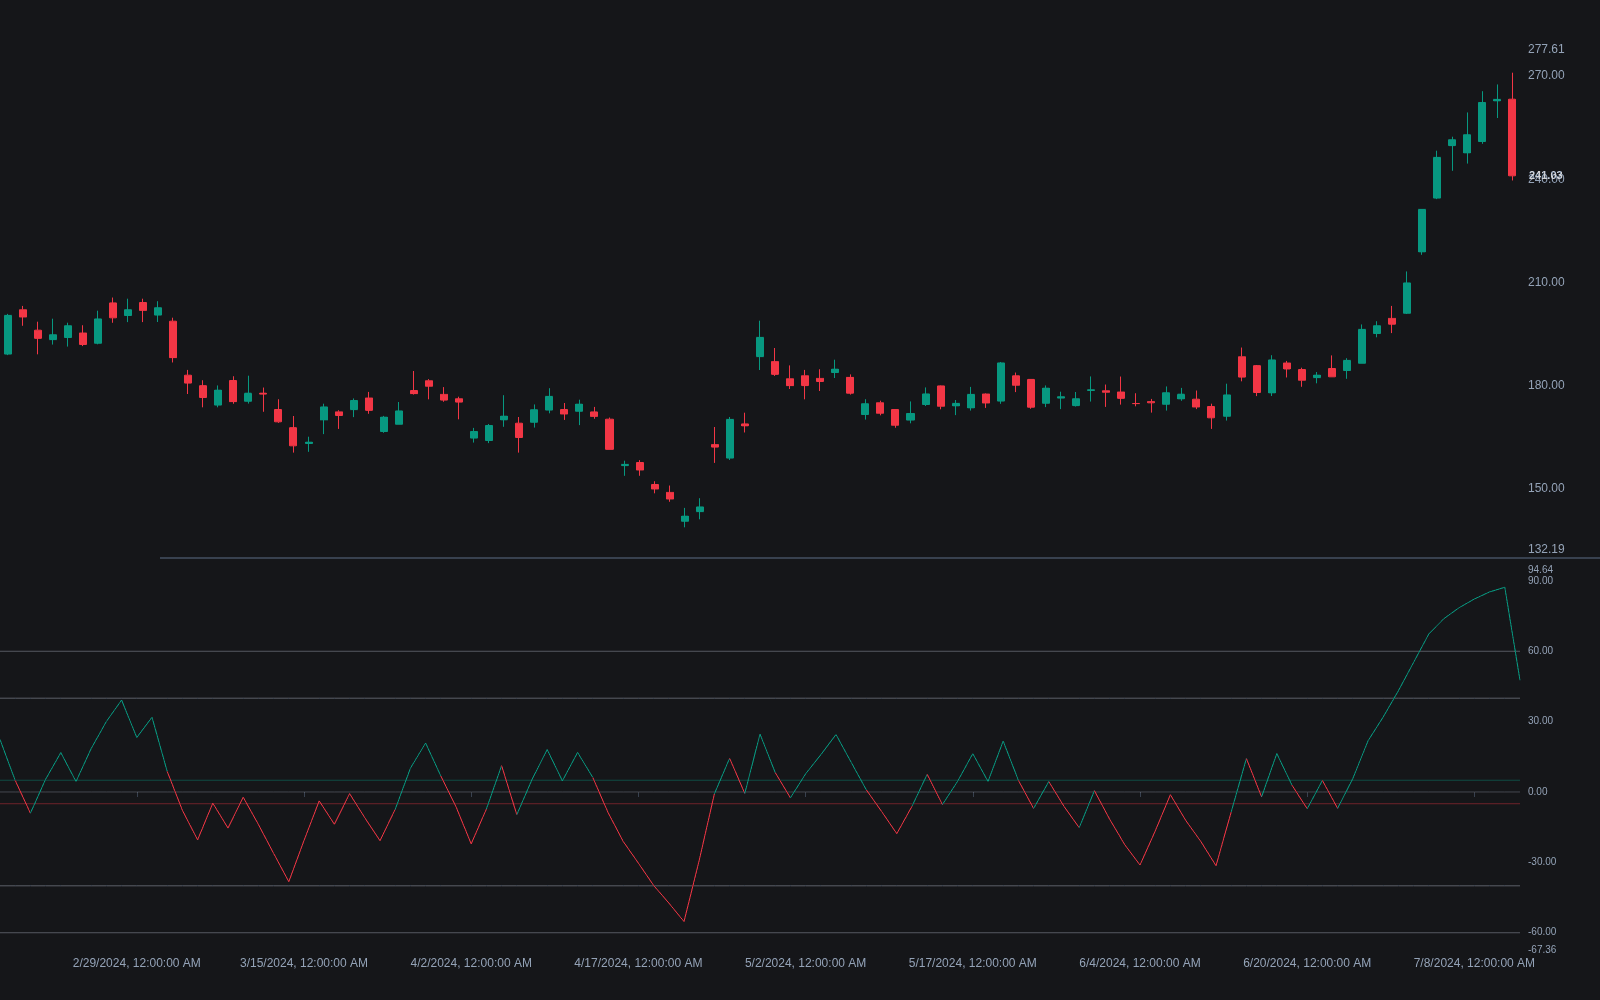
What is the Volume Zone Oscillator?
The Volume Zone Oscillator (VZO) is a bounded volume oscillator introduced by Walid Khalil and David Steckler in 2009. Each bar's volume is signed by close direction: positive when the close is above the prior close, negative when below. The VZO is the exponential moving average of that signed volume divided by the exponential moving average of total volume, multiplied by 100, so readings fall between -100 and +100; 14 periods is a widely used length.
As the name suggests, it is read in zones rather than by crossovers alone. The published guidance describes a bullish volume regime above roughly +5 and a bearish one below -5, with the ±40 area watched as overbought/oversold territory in ranging markets and ±60 as extreme. Because only the sign of the close-to-close change classifies volume, the VZO answers one narrow question, whether turnover is concentrating on up closes or down closes, and like any bounded oscillator its extremes can persist in trends.
The original publication, a Technical Analysis of Stocks & Commodities article, framed the oscillator as one part of a workflow rather than a standalone signal: the authors paired it with a long moving average for trend context and a strength gauge, letting the VZO's zones time entries only in the direction the trend tools permitted. That framing survives in practice. The ratio construction is worth appreciating too: dividing smoothed signed volume by smoothed total volume normalizes activity out of the reading, so the VZO reports the share of turnover leaning one way, not the amount, which is what keeps it bounded and comparable across quiet and busy periods.
Its natural companions differ from the usual price-oscillator stack precisely because its magnitude comes from volume, with price contributing only a sign. Dashboard builds like the Library's CCI/MFI/VZO/RSI heatmap exploit that: three price-fed gauges plus one volume-fed gauge cover more failure modes than four price oscillators agreeing with each other. The honest caveats are the mirror of the design: the close-to-close sign is a crude classifier that mislabels gap days and intrabar reversals, and the reading inherits whatever the venue's volume feed gets wrong.
How to identify Volume Zone Oscillator readings
One ratio, several zones: identification is the construction plus the map the authors published.
- 1Sign each bar's volume by close direction: positive above the prior close, negative below it.
- 2Smooth the signed series and the raw total with EMAs of the same length, 14 periods classically.
- 3Divide and scale: smoothed signed volume over smoothed total volume, times 100, bounded between -100 and +100.
- 4Apply the zone map: the ±5 area as the bull/bear regime boundary, ±40 as range-market extremes, ±60 as climactic.
- 5Frame it with trend context, per the original guidance, so zone reads fire with the prevailing direction rather than against it.
How it's calculated
VZO expresses smoothed net directional volume as a percentage of smoothed total volume, oscillating between -100 and +100.
Published by Walid Khalil and David Steckler (2009); the default length is 14, and abs(SV_t) = V_t keeps VZO inside -100 to +100.
The published zones read +5 to +40 as bullish and -5 to -40 as bearish, with moves beyond +40/+60 overbought and beyond -40/-60 oversold.
Implementations differ on flat closes: some assign zero signed volume when C_t = C_(t-1) instead of -V_t.
How traders use it
- As a volume-regime filter: holding above the bullish boundary supports long setups and holding below the bearish boundary supports shorts, while readings oscillating around zero warn that neither side's volume dominates.
- As an extreme-fade tool in ranges: pushes toward ±40 and beyond are watched for reversion when the market is rangebound, while in trends the same extremes read better as strength, the familiar caveat with RSI extremes.
- As confirmation from a different input: the VZO's magnitude comes from volume, with price contributing only the sign, so its agreement with a price-based oscillator adds information in a way that stacking two price oscillators, which share inputs, does not.
- In multi-oscillator dashboards: heatmap-style panels slot the VZO beside CCI, MFI and RSI so one volume-fed gauge audits three price-fed ones, and unanimous readings carry genuinely independent evidence.
- As a divergence read: price printing a new high while the VZO posts a lower high says the advance's turnover share is fading, a bounded-oscillator variant of the volume divergence warning.
VZO vs related volume oscillators
Volume Oscillator: The standard volume oscillator compares fast and slow averages of unsigned volume, measuring whether activity is expanding regardless of direction. The VZO signs volume first, measuring which side the activity favors. How much versus whose: different questions from the same feed.
OBV: OBV accumulates signed volume into an unbounded line that trends with participation flows; the VZO expresses signed volume as a bounded share of total turnover. OBV suits long divergence studies, the VZO suits zone and regime reads; one drifts, the other oscillates.
Money Flow Index: MFI weights typical price by volume and tracks where money flow sits inside a bounded range, letting price magnitude into the reading. The VZO strips price down to a sign, so the two bounded gauges disagree exactly when price moves big while turnover stays balanced, or vice versa.
Concept family
Volume & Order Flow
88 concepts mapped · 88 in the Library
Volume Zone Oscillator FAQ
Turn Volume Zone Oscillator into a trading strategy.
Take the implementation from this page into Quant, then build on it, backtest it on real data, and keep refining it in conversation.