Concept
Yang-Zhang Estimator
Yang-Zhang Estimator is a Volatility concept. The Library holds 1 implementation, a working definition you can pull into Quant.
open/close + overnight decomposition
Top Yang-Zhang Estimator indicator
The top custom implementation, built on the original standard Yang-Zhang Estimator formula.
1 total
From studying Yang-Zhang Estimator to trading it: take the implementation below into Quant and backtest it instantly.
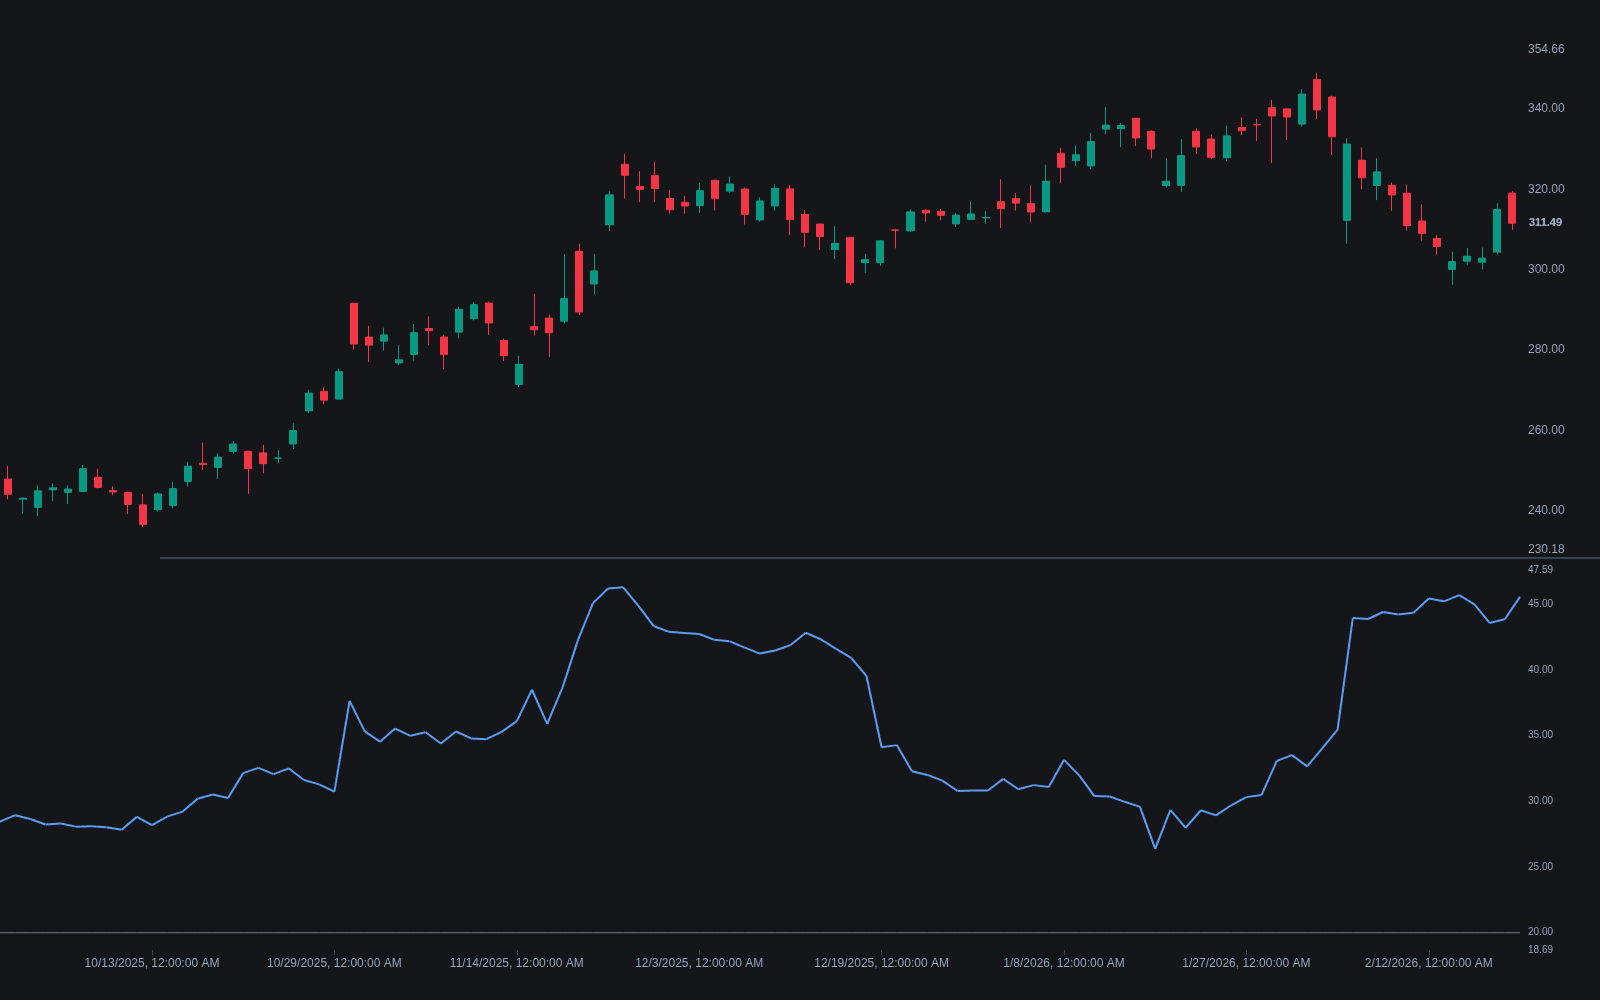
What is the Yang-Zhang Estimator?
The Yang-Zhang estimator is a realized-volatility estimator for OHLC bars, published by Dennis Yang and Qiang Zhang in 2000. It decomposes variance into three parts: an overnight component from close-to-open log returns, an open-to-close component, and the Rogers-Satchell range term built from each bar's high, low, open, and close. Summing them with a variance-minimizing weight fixes the two classic blind spots of range-based estimation at once: unlike the Parkinson and Garman-Klass estimators it accounts for opening gaps, and the Rogers-Satchell term keeps it unbiased when price drifts (trends) across the window.
It sits at the end of a lineage of estimators developed to squeeze more information out of each bar. Parkinson's 1980 estimator used the high-low range; Garman and Klass added the open and close the same year; Rogers and Satchell (1991) removed the zero-drift assumption; and Yang and Zhang's 2000 paper in the Journal of Business combined the pieces into an estimator that is unbiased under both drift and opening jumps, with the minimum variance among estimators of its form. It holds up in exactly the conditions that mislead simpler estimators: opening gaps and strong trends within the window.
Those properties make it a common default when a single realized volatility number must come from daily bars. Because it uses the full bar rather than closes alone, it reaches a given level of statistical stability from fewer bars than close-to-close historical volatility, which matters when the lookback has to stay short. It remains a sample statistic: it describes the window it was computed over, inherits any bad opening or high/low prints in the data, and is not a forecast.
For chart-based traders the estimator fills a gap between indicator conventions. Tools like Bollinger Bands measure volatility as the standard deviation of closes and ATR measures it as smoothed true range in price units; Yang-Zhang instead produces an annualized percentage comparable across instruments and directly against option-implied volatility. That makes it a natural engine for volatility targeting, regime dashboards, and any workflow where the question of how volatile a market currently is needs a number that survives gaps and trends.
How to calculate the Yang-Zhang Estimator
The estimate combines three variance components over an n-bar window; all returns are log returns.
- 1Build two return series per bar: the overnight return, log of the open divided by the prior close, and the open-to-close return, log of the close divided by the same bar's open.
- 2Take the ordinary sample variance of each series across the window (deviations from each series' own mean), giving the overnight variance and the open-to-close variance.
- 3Compute the Rogers-Satchell variance over the same window from each bar's high, low, open, and close; this is the drift-independent range component.
- 4Combine as overnight variance plus k times open-to-close variance plus (1 minus k) times Rogers-Satchell variance, where k = 0.34 / (1.34 + (n+1)/(n-1)) as derived in the original paper. Annualize by scaling the per-bar variance by bars per year, then take the square root.
How it's calculated
The Yang-Zhang estimator combines overnight, open-to-close, and Rogers-Satchell variances into a single volatility estimate that is independent of drift and captures opening gaps.
From Yang and Zhang (2000); it stays unbiased when the series trends (drift) and prices in the overnight gap, whereas Parkinson and Garman-Klass assume zero drift and Rogers-Satchell ignores the gap.
Sums run over the n most recent bars; match A to the bar frequency (252 daily, 52 weekly, 12 monthly).
Some sources quote the variance (the expression under the square root) rather than the volatility; multiply by 100 to quote percent.
How traders use it
- As the volatility input for anything scaled by realized vol: position sizing, stop distances, and band widths built on close-to-close volatility can swap in Yang-Zhang for a steadier estimate from the same data, with the biggest gains on instruments that gap overnight.
- As the engine for short-window regime work: because each bar contributes more information, shorter lookbacks become statistically usable, which sharpens multi-window comparisons and volatility percentile ranks.
- As a realized benchmark against implied volatility: comparing an efficient realized estimate to option-implied levels is a standard way to frame whether volatility is being priced rich or cheap, though neither side is obliged to converge on any schedule.
- As a cross-check on squeeze studies: compression flagged by BandWidth or the TTM Squeeze can be verified against a Yang-Zhang series to confirm that measured volatility, gaps included, is genuinely contracting, a cleaner read on range expansion and contraction cycles.
- For cross-market comparison and volatility targeting: because the output is an annualized percentage, portfolios can size positions inversely to it and compare regimes across assets, something ATR's price units cannot do directly.
Yang-Zhang vs. other volatility measures
Realized Volatility: Yang-Zhang is one estimator within the realized-volatility family. The reference implementation uses close-to-close returns only; Yang-Zhang adds the open, high, and low so each bar contributes more information, cutting sampling noise at the cost of needing clean OHLC data.
ATR: ATR is a smoothed average of true range in price units, built for stops and position sizing on charts. Yang-Zhang is a statistical variance estimator, annualized and comparable across instruments and to implied volatility. They respond to the same turbulence but answer different questions.
BandWidth: BandWidth reads how wide Bollinger Bands are relative to their middle line, a chart-native squeeze detector driven by the standard deviation of closes. Yang-Zhang measures the same phenomenon from richer inputs and in absolute annualized terms rather than relative to a moving average.
Concept family
Volatility
57 concepts mapped · 57 in the Library
Yang-Zhang Estimator FAQ
Turn Yang-Zhang Estimator into a trading strategy.
Take the implementation from this page into Quant, then build on it, backtest it on real data, and keep refining it in conversation.