Ensemble Learning for Chart Patterns
Ensemble learning combines predictions from multiple machine-learning models. For chart patterns, that can mean combining estimates of whether a formation is present, whether a breakout will hold, or what return might follow. These are different questions, and each needs its own labels and evaluation.
An ensemble may improve on a single model, but it does not promise a fixed increase in accuracy or a reduction in drawdown. Start with a clearly defined pattern, compare against a simple baseline, and test on later data that played no role in choosing the model.
Ensemble models for chart pattern detection
The main approaches differ in how they combine learners. The scikit-learn ensemble guide explains averaging, boosting, voting, and stacking. None is universally best for financial data.
| Approach | How it works | Trading research consideration |
|---|---|---|
| Bagging and random forests | Combine trees trained with randomized samples or feature choices. | A useful comparison model for tabular price and indicator features; correlated errors can still persist. |
| Gradient boosting | Add learners sequentially to improve a chosen loss function. | Test complexity, learning rate, and stopping rules; fitting historical detail can hurt later results. |
| Voting or averaging | Combine class decisions or numerical predictions, with fixed or learned weights. | Use models predicting the same target on the same observation horizon. |
| Stacking | Train a final model using base-model outputs. | The training predictions must be generated without giving base models access to those outcomes. |
Random forests can model nonlinear relationships without assuming that each feature affects the result in a straight-line fashion. Gradient-boosted systems such as XGBoost and LightGBM offer another approach. Choosing one requires evidence from the intended dataset, rather than a claimed universal accuracy ranking.
Stacking requires careful timing
A meta-model should learn from predictions that were made without training on the corresponding answers. For time series, those predictions also need to respect chronology. For example, train base models on an earlier period, predict a later development block, and repeat forward before fitting the combiner on those recorded predictions.
Do not assume a library's default stacking configuration handles this. StackingClassifier uses cross-validated predictions, but its default classification splits are stratified folds rather than a forward-only trading simulation. Training a combiner on predictions from models already fitted to those same rows can overfit badly. A custom temporal prediction pipeline may be necessary; evaluate the complete stack on a separate later period.
Define the pattern and outcome separately
A chart-pattern detector answers a recognition question. A trading model answers an outcome question. A system can identify a head-and-shoulders formation correctly and still lose money trading it. Likewise, a model can predict positive returns without identifying any named formation.
- Pattern label: Specify the geometry, lookback, tolerance, and confirmation condition. Include examples without the pattern, and document ambiguous cases.
- Outcome label: Specify exactly which future prices determine success, the horizon, and whether costs are included. Keep those future values out of the inputs.
- Availability time: Record when the pattern became identifiable. A swing requiring subsequent candles cannot be treated as known at the earlier turning point.
- Trade rule: Define the entry, exit, size, and treatment of overlapping signals separately from the classification label.
For example, a five-bar return label cannot be known at the signal bar. If a training row's outcome extends into the validation period, remove it from that training window. When using several instruments, split by decision time across the dataset so the model cannot learn later market conditions from another symbol.
Prepare features without future information
Begin with timestamped open, high, low, close, and volume data. Record the venue, timezone, session, corporate-action treatment, and missing-data policy. A dataset assembled from today's surviving stocks can miss securities that disappeared during the test period.
Candidate inputs include returns over fixed lookbacks, candle body and wick proportions, range relative to recent volatility, volume relative to its trailing average, moving-average distance, and momentum readings. Keep definitions reproducible. Several indicators derived from the same closing prices may contribute little independent information.
Fit any scaler, imputer, or feature-selection step on training data only, then apply the fitted transformation to later observations. Scaling every feature to 0–1 is not a universal requirement; preprocessing depends on the estimator. The scikit-learn guidance on leakage and preprocessing explains why pipelines help keep learned transformations inside the correct split.
For multiple timeframes, use only higher-timeframe values available at the decision timestamp. The final high, low, close, or volume of a still-forming daily candle cannot be supplied to an intraday model as though the day were already complete.
Validate the full research process
- Set a baseline. Compare the ensemble with a single model and a simple rule using the same labels, dates, and available information.
- Reserve later data. Use earlier development windows for feature choices, model selection, and thresholds. Keep the final test untouched until those decisions are fixed.
- Move forward through time. Train on past observations and evaluate on subsequent blocks. Specify expanding or rolling training windows and a realistic retraining schedule.
- Control the search. Record tested variants, including unsuccessful ones. Bayesian optimization and other searches still need development-only evaluation; they do not remove selection bias.
- Evaluate the frozen process. Include preprocessing, model fitting, ensemble weights, thresholds, and execution rules. A clean split for only the final estimator is insufficient.
TimeSeriesSplit supplies ordered training and test indices and a gap between them. Its equal-spacing assumption matters when comparing fold durations. A row-count gap is not a complete solution for irregular events, variable outcome horizons, or multi-asset datasets: check the actual timestamps and label endpoints.
Accuracy can hide missed patterns
Consider a hypothetical test containing 1,000 observations, of which 50 truly contain the target pattern. Predicting “no pattern” every time achieves 95% accuracy while detecting none of the patterns.
Suppose another model flags 30 observations: 20 are correct detections and 10 are false alarms. It misses 30 patterns and correctly rejects 940 other observations. Its accuracy is 96%, precision is 20 ÷ 30 = 66.7%, and recall is 20 ÷ 50 = 40%. The extra accuracy point does not tell the whole story. These numbers illustrate metric calculation, not results from a trading system.
Report the confusion matrix and class counts alongside precision and recall. For a return forecast, use metrics appropriate to that numerical target. Then evaluate the actual trade simulation: net results after fees and slippage, drawdown, exposure, turnover, trade count, and sensitivity to delayed execution. Classification accuracy is not a win rate or a return forecast.
Use LuxAlgo to build a transparent baseline
LuxAlgo brings native chart analysis and Quant, our coding agent, into the research workflow. Use the charts to inspect a candidate pattern and its surrounding conditions, then turn an explicit rule into a strategy you can review. This gives a machine-learning experiment a concrete benchmark.
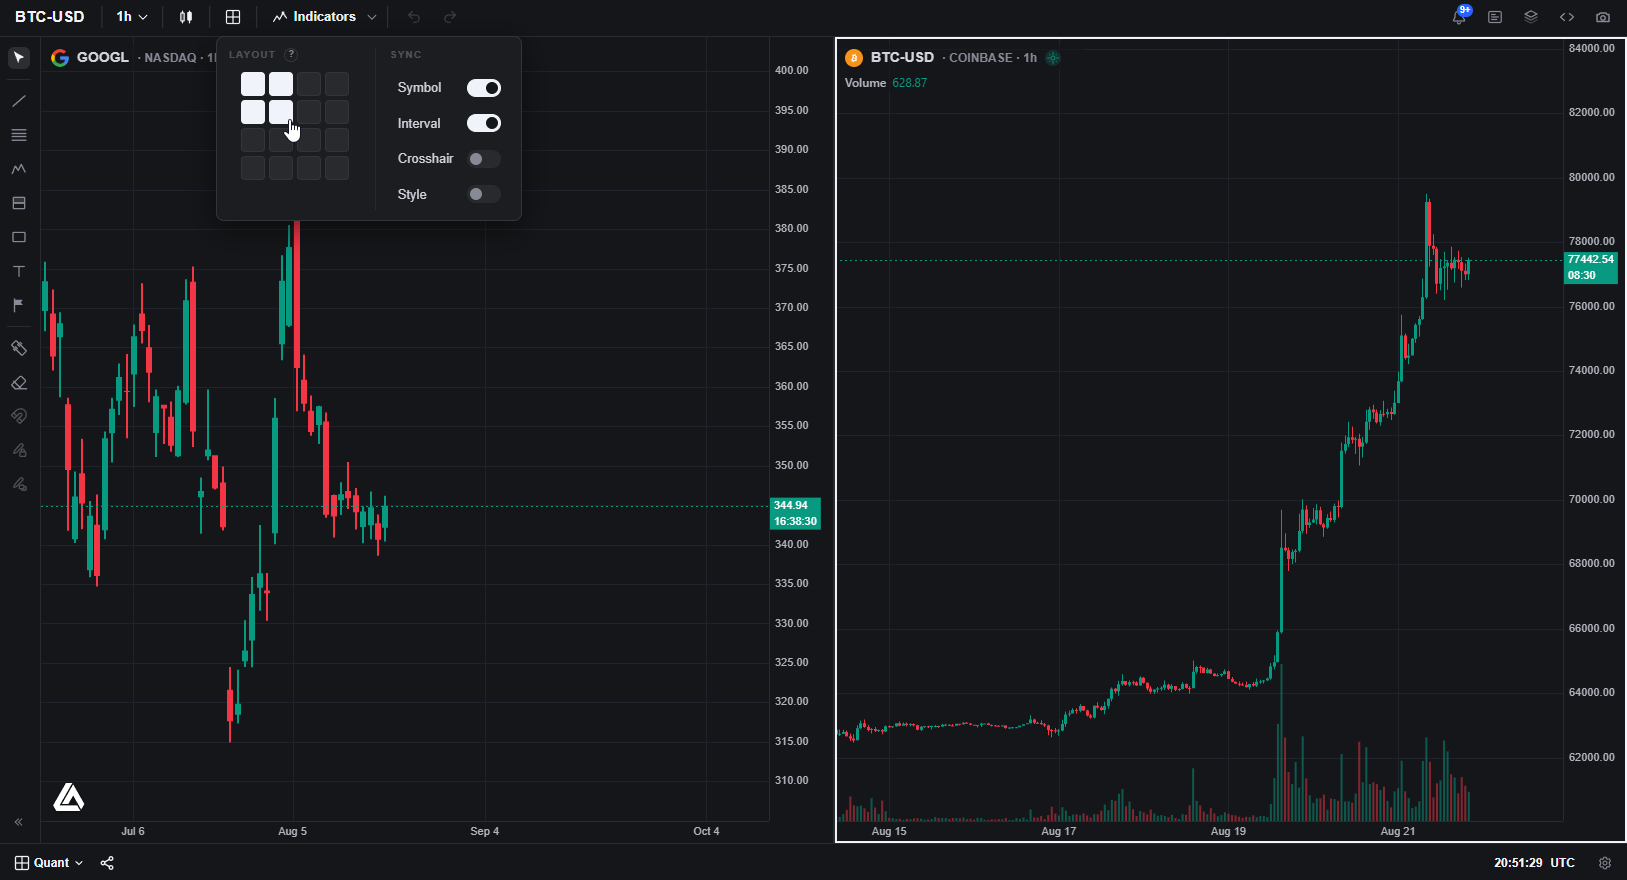
For a simple breakout benchmark, specify: evaluate completed candles; signal when the close exceeds the highest high of the previous 20 completed candles; enter only when flat at the next bar's open; exit at the next open after a close below the lowest low of the preceding 10 completed candles; use a fixed, stated allocation and explicit costs. Exclude the signal candle from the lookback. Define the test-end treatment of any open position before comparing results.
Ask Quant to implement those rules, then inspect the code and individual trades. Its strategy workflow supports plain-language instructions, code review, chart backtests, configurable inputs, and simulation properties such as commission and slippage. Confirm execution timing rather than assuming generated code matches the specification.
Train a random forest, boosted model, or stack in an appropriate external machine-learning environment. Do not assume a saved Python model can be imported into Quant or that a chart backtest automatically performs ensemble training, temporal validation, or portfolio optimization. Compare the external experiment with the rule-based baseline only after matching data, timestamps, costs, and position accounting.
Advanced uses and risk controls
Indicator combinations: Test whether adding trend, momentum, or volume features improves later-period results relative to price-only inputs. A larger collection of correlated indicators is not automatically a more diverse ensemble. Feature-importance rankings describe the fitted model and should not be treated as proof of causation.
Adaptive weighting and retraining: A changing model needs a predetermined update rule and data-availability checks. Evaluate that update process historically using only information available at each update. Retraining can respond to changed relationships, but it can also fit recent noise; monitor deterioration and maintain a documented fallback.
Uncertainty and position sizing: Model agreement is not certainty, and raw classifier scores should not be assumed to be calibrated probabilities. If confidence changes exposure, test that sizing rule separately from the signal. Retain exposure limits and stress losses under adverse fills; a stop price is not a guaranteed execution price.
Portfolio applications: Combining forecasts across assets requires shared-capital accounting, correlation analysis, cash limits, and realistic rebalancing costs. Adding independent single-chart profits together does not establish a tradable portfolio result.
Start with one target and a manageable feature set. Add complexity only when later-period evidence supports it, and preserve the full research record so the result can be reproduced.
FAQs
How does machine learning recognize patterns?
A supervised model learns a relationship between defined input features and labeled examples, then applies that relationship to new observations. Chart-pattern research needs consistent labels, features available at the decision time, and evaluation on later data. Recognizing a formation does not establish that trading it will be profitable.
What is the goal of using ensemble models rather than individual models?
The goal is to improve generalization by combining models whose errors may differ. The benefit must be measured against a single-model baseline on unseen data. Ensembles can still overfit, share the same blind spots, and lose effectiveness when market relationships change.
Read next