Replay Mode Is Now Free in QuantCharts
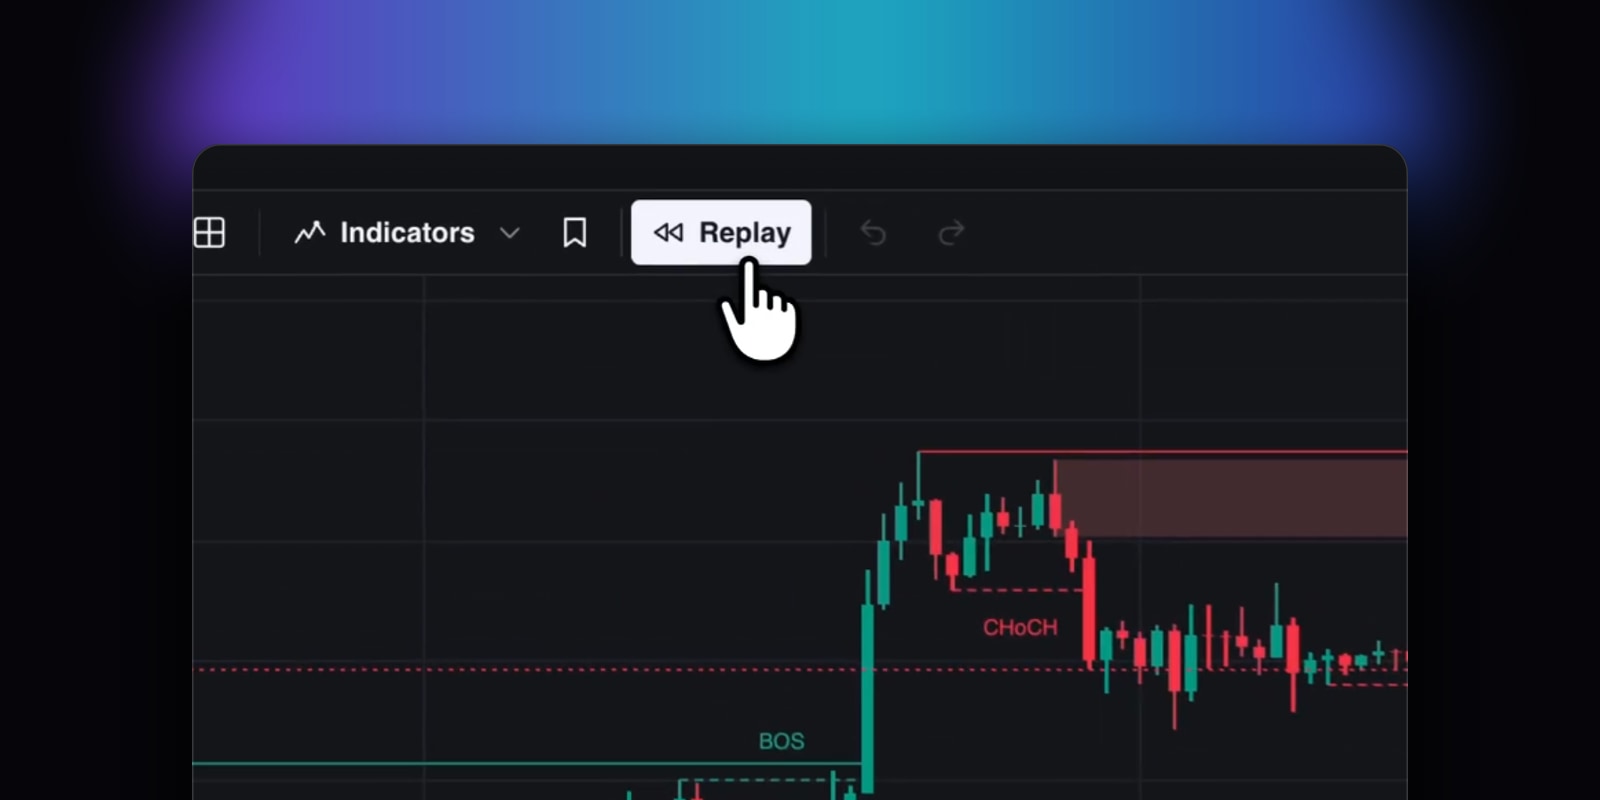
We built Replay Mode for QuantCharts so you can work through chart history as it unfolded. Choose a starting date or a specific candle, set the update speed, and watch the chart play forward one bar at a time.
This gives you a direct way to backtest trades and simulate a setup without relying only on a static view of the chart. You can place your attention at a defined point in history, then observe how the setup develops as new candles appear.
Replay Mode lives in the charting experience at https://app.luxalgo.com/quant. It also supports multi-chart displays natively, so replay can follow the layouts you already use to read a setup.
Start from any point in chart history
Replay begins with a choice: select a start date or pick a specific candle from the chart history with the slider. This lets you study a setup from the point where the information would have been available, rather than beginning with the full move already visible.
To start, open QuantCharts at https://app.luxalgo.com/quant, open the chart you want to review, and select Replay from the chart controls. Use the history slider to move to a start date or candle, then begin playback. The chart advances from that point so you can evaluate the sequence as it develops.
For example, you can select the candle where a setup first becomes relevant, start Replay Mode, and follow the next candles without using later price action to choose the entry in advance. The same process works when you want to inspect how a specific historical structure formed and what followed it.
Control the pace of the replay
A replay is more useful when its pace matches the decision you are testing. QuantCharts lets you set the update speed before watching the chart play, giving you control over how quickly the historical candles appear.
From the Replay controls, choose the starting point with the slider, set the update speed, and play the chart. Slow the sequence down when you are examining the relationship between candles, or use a faster pace to review a longer section of history. You can focus on the point where your trade decision would have been made and then continue through the outcome of the setup.
This creates a repeatable way to simulate a trade. Start at the selected candle, define the setup using only the chart information available at that moment, and let the replay reveal the following price action. You can then review whether the trade idea remained valid as the chart moved forward, without changing the historical starting point.
Backtest trades in the chart environment
Replay Mode turns historical chart data into an active testing environment. Instead of scanning a completed chart and judging a trade with the entire move visible, you can reconstruct the decision process from a chosen date or candle.
Open Replay from the chart controls, move the slider to the candle where you want the test to begin, and set the update speed. As the chart advances, simulate the setup and backtest the trade through the historical candles that follow. The chart remains the place where you read the setup and follow its development.
This is useful for testing a setup across different points in chart history. You can select one candle, play forward, review what happened, and then repeat the process from another starting point. The key variable is clear: the chart begins where you chose, and the subsequent candles are revealed through playback rather than shown all at once.
Replay across multi-chart displays
Replay Mode has native support for multi-chart displays. You can continue using a multi-chart layout while replaying chart history, rather than treating each chart as a separate review.
To use it, open a multi-chart display in QuantCharts, select Replay, choose the historical start date or candle with the slider, and set the update speed. Start playback and observe the display as the replay progresses. The feature is built into the multi-chart experience, so you can review the charts together while simulating the setup.
A multi-chart display can help when your process depends on more than one view of the market. Start the replay at the candle that matters to the setup, then watch the connected chart views advance through the same historical sequence. This keeps the review aligned across the display instead of requiring separate manual playback.
A more controlled way to study setups
Replay Mode adds a defined process to historical chart review. You choose the starting date or candle, control how quickly the candles update, and decide how to evaluate the setup as history unfolds. The result is a chart-based workflow for replaying history, backtesting trades, and simulating decisions.
There is no need to wait for a live setup to appear before practicing the process. Select a point in chart history, start the replay, and work through the next candles with the same attention you would bring to a developing chart. When the review involves multiple chart views, use the native multi-chart support to keep them in the same replay.
Try Replay Mode in QuantCharts
Open QuantCharts, select Replay, choose a date or candle with the slider, set the update speed, and start the chart. QuantCharts now gives you a controlled way to study chart history and simulate your setup as it develops.
Read next