Quant Can Now See and Control Your Charts
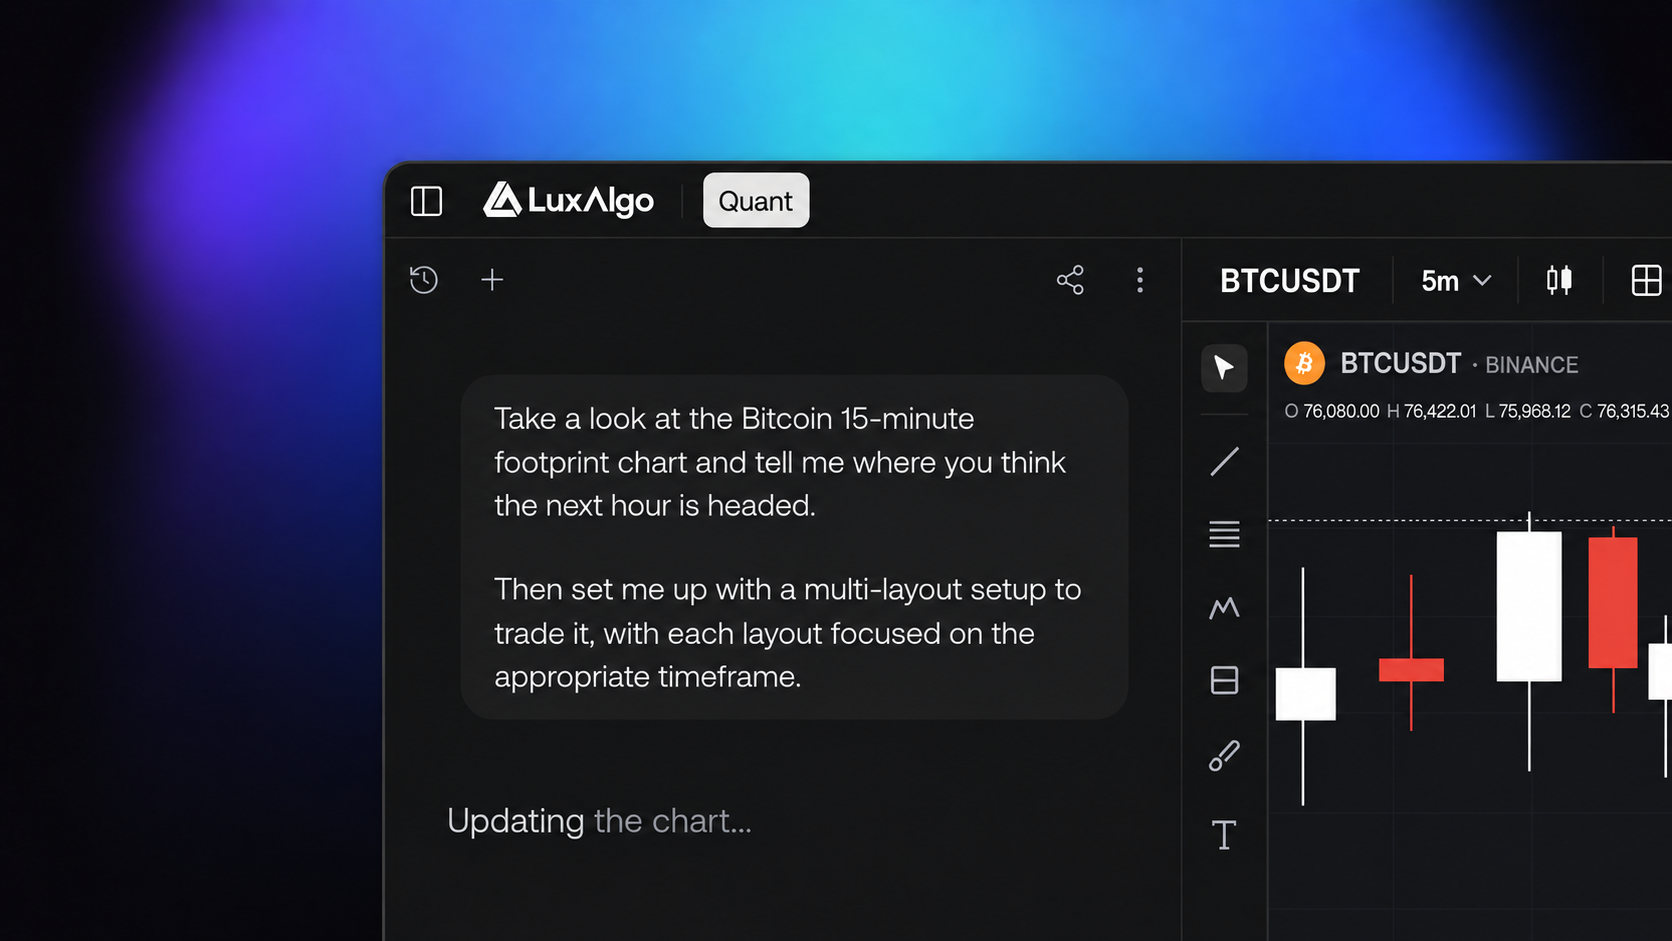
We built a new way to work with Quant inside LuxAlgo. Quant can now configure your chart and see the result from a single prompt, giving your indicators, strategies, and analysis the context they need before you begin.
You can ask Quant to prepare a chart for a specific market and timeframe, investigate a historical period, or check whether an indicator is displaying correctly. It can change the chart configuration, visualize the chart, and repeat that visual check when a task requires more than one pass.
The result is a more direct workflow inside the AI trading & charting platform. Instead of setting up the chart first and then describing its state to Quant, you can give it the request and let it work with the chart in front of you.
Set the chart context from one prompt
Quant can change the settings that determine how your chart is presented. That includes the symbol, timeframe, chart type, multi-chart layout, price scale, session type, and visible range. These controls let Quant prepare the chart before it builds or evaluates the work you requested.
A request such as “I want a strategy for NVDA 15m” gives Quant a clear chart context to prepare. A request about January 2025 can direct it to the relevant historical range, while a request to highlight the post session range can require the appropriate session type and chart view. The configuration happens as part of the task rather than as a separate setup exercise. The chart becomes part of the instruction: Quant prepares the relevant view before continuing with the approved work. You can specify the full setup in your initial request or adjust it with a follow-up prompt.
Let Quant inspect what is actually on the chart
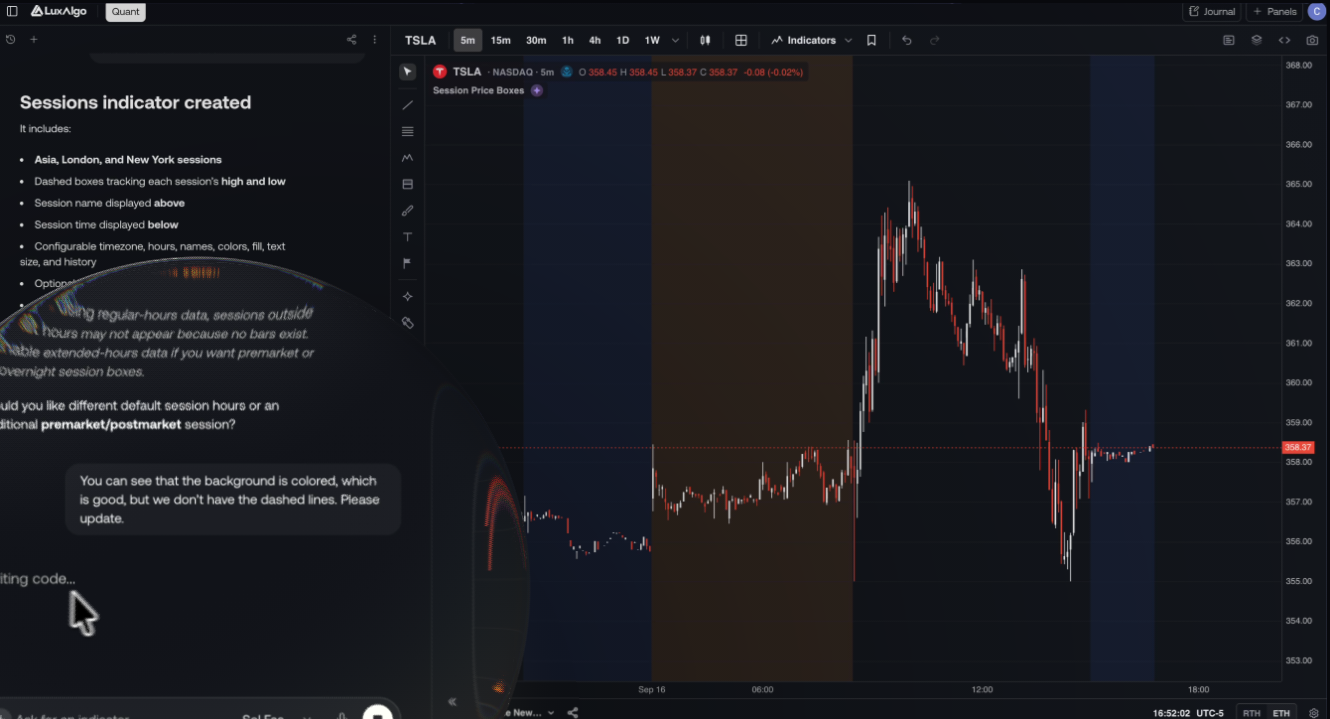
Quant can now visualize the user chart. This means it does not only write or repair indicator and strategy code. It can also inspect the rendered result and use that view to understand whether the requested work appears as intended.
Visualization can happen multiple times in a single turn. Quant may complete a complex chart task, inspect the result, identify a visual issue, make a correction, and check the chart again. It can also wait for an indicator to finish loading before it evaluates the chart, so the inspection happens after the relevant output is available. Ask Quant to check an indicator that is not plotting correctly, either in your original request or after the task is complete. It can use the rendered chart to guide the correction.
This creates a feedback loop between the code and the chart. The chart is not treated as a static destination after the code runs. It becomes a source of information Quant can use while building and repairing the result.
Build and debug in the right visual context
The new harness connects chart configuration and chart visualization in one workflow. Quant can first move the chart to the context your request requires, then use the resulting view to guide the work. That matters when the same indicator or strategy can look different across symbols, timeframes, sessions, layouts, and visible ranges.
A trader preparing a strategy for NVDA 15m can ask Quant to establish that context before the strategy is built. Someone investigating what happened in January 2025 can ask Quant to move to that period and then inspect the chart. A request involving the post session range can begin with the relevant session view and continue with a visual check of the plotted result.
The workflow is direct:
- Open Quant.
- Describe the chart context and the task you want completed.
- Let Quant change the required chart settings and perform the approved work.
- Ask Quant to visualize or check the chart when the result needs inspection.
- If the chart is not correct, let Quant continue the task and check again. You remain in control of what Quant runs and approves.
Try Quant Control
Open Quant and name the symbol, timeframe, historical period, session, or visual issue you want it to work on. Start with a complete request or refine the chart with a follow-up prompt.
Compare plans, monthly credits, and chart limits on the LuxAlgo pricing page. Trading shouldn’t be a guessing game, and the chart should provide the context for the work.
Read next