Backtests Now Show Alternative Outcomes
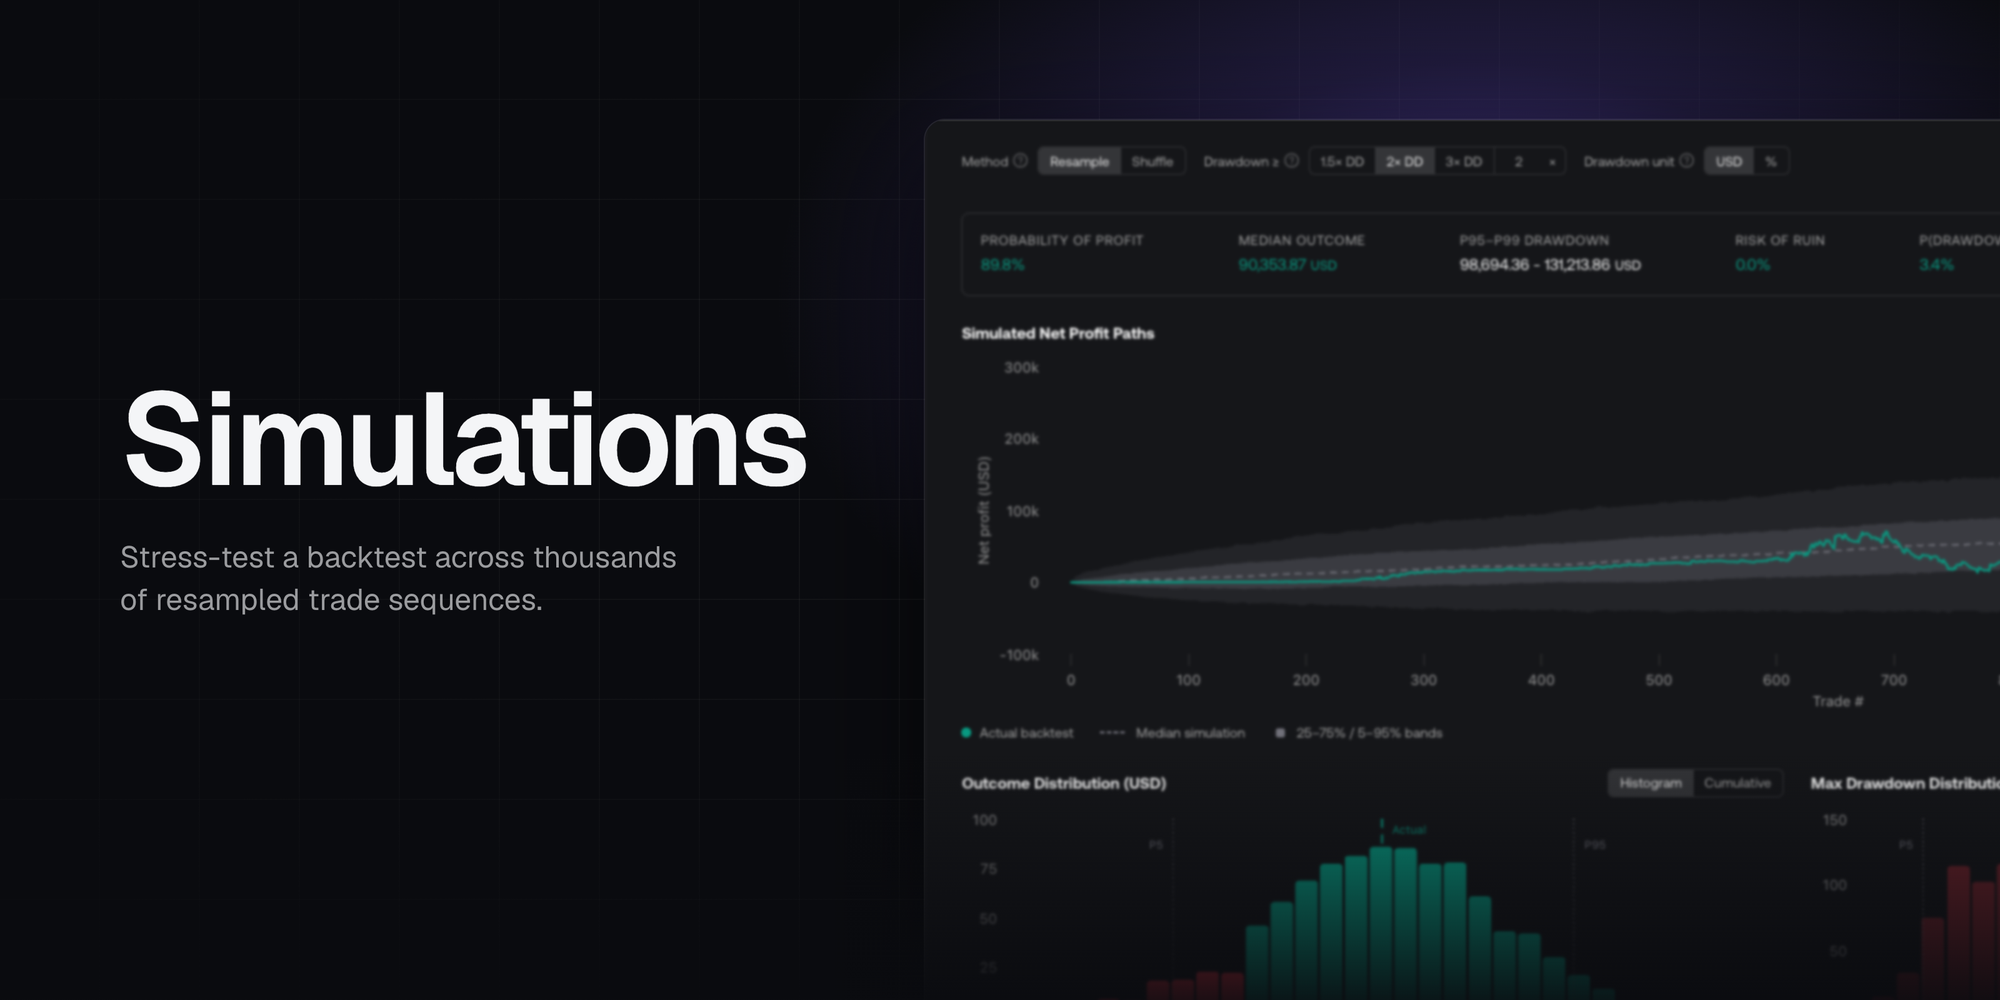
A backtest gives you one historical result: the trades your strategy took, in the order they happened. That result is useful, but it does not show how much the outcome depended on that particular trade selection or sequence.
We built Simulation into the Backtest Viewer to make those alternative paths visible. These Monte Carlo simulations replay your strategy’s closed trades so you can compare profit paths, drawdowns, losing streaks, and recovery times.
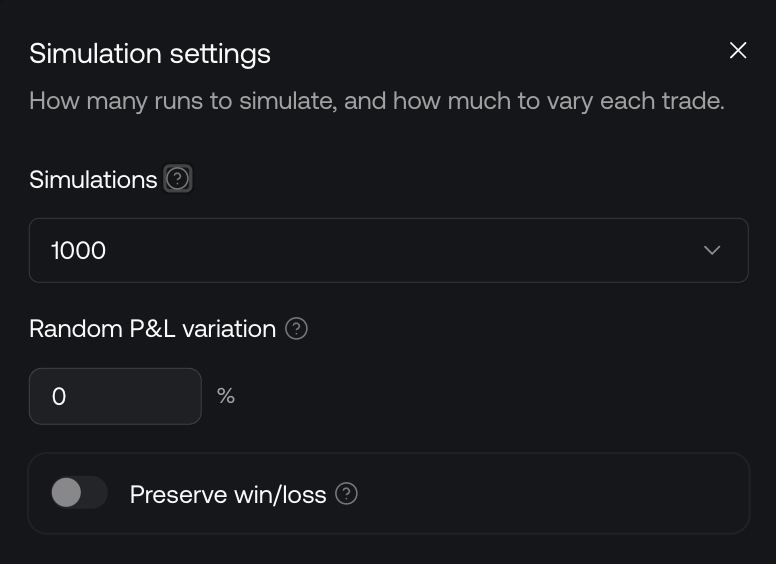
Open Quant, run or review a strategy backtest, and select Simulation in the Backtest Viewer. Choose Resample or Shuffle, then use Simulation settings to select 250, 1,000, or 2,500 runs. Each run is a replay of the trade history—not one trade.
See more than the single backtest path
A strong-looking profit curve can hide sensitivity to trade order. If losing trades arrive closer together, the same strategy can experience a deeper drawdown or a longer recovery. Simulation lets you compare the original path with a wider range of outcomes generated from its historical trades.
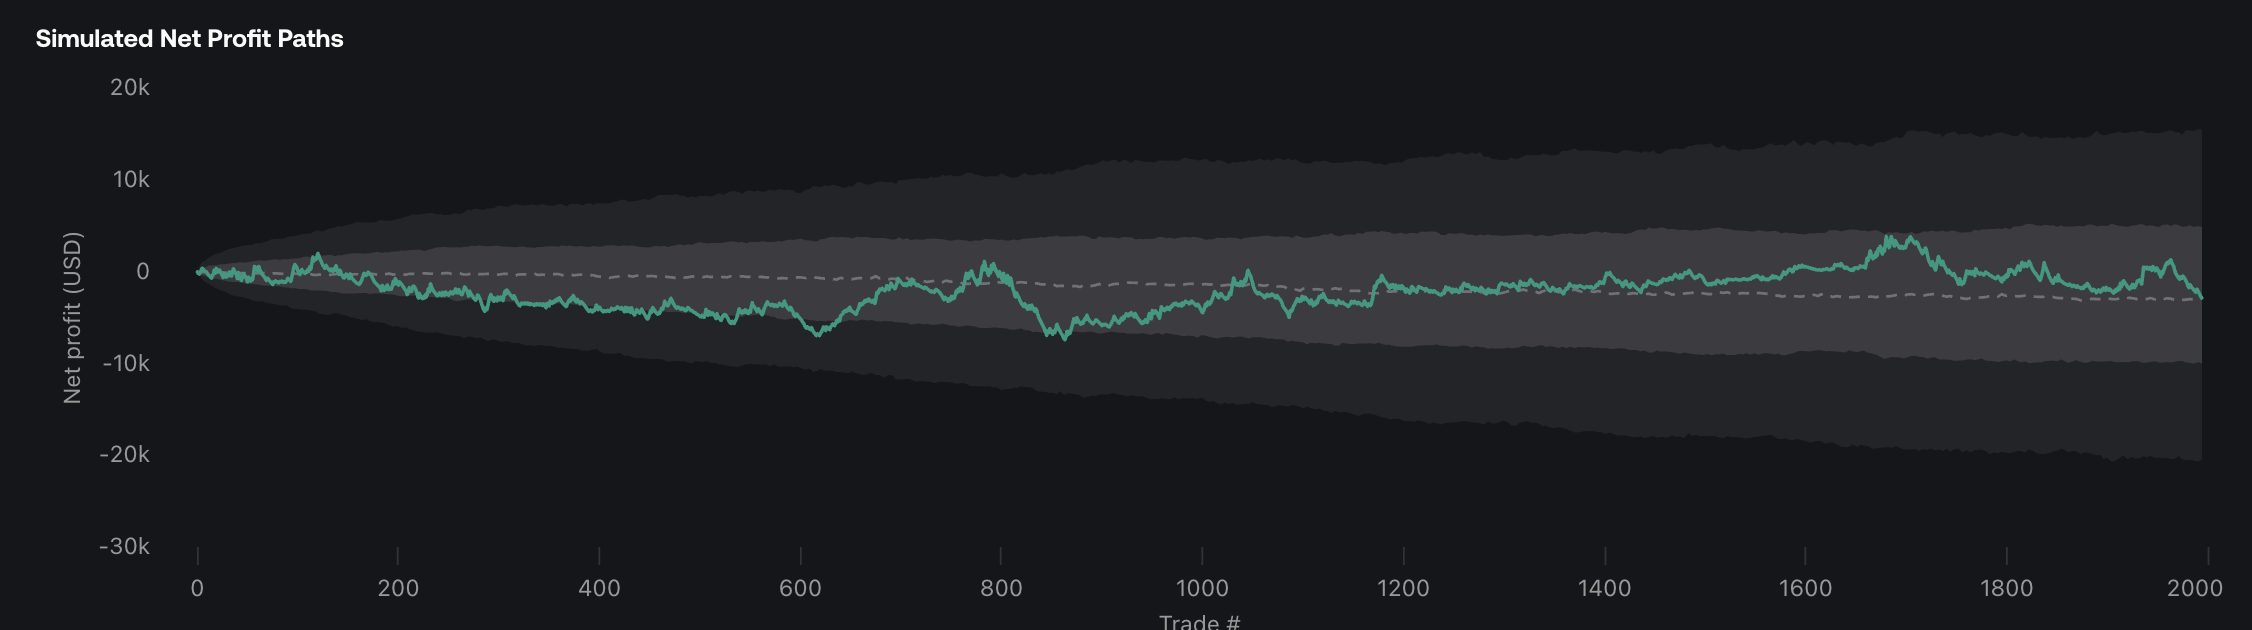
The Simulated Net Profit Paths chart shows the actual backtest, the median simulation, and shaded 25–75% and 5–95% bands. These contain the middle 50% and 90% of simulated values at each point. They are not guaranteed boundaries for an entire run, and the median line need not represent any one run.
Resample trade combinations
Resample draws historical trade results with replacement. A trade can appear more than once in a run, while another may not appear at all. This explores how outcomes change when the observed mix of trades changes.
For example, three trades of +$100, −$50, and +$200 total +$250. A resample could draw +$100, +$100, and −$50, ending at +$150. Other combinations can finish higher or lower.
Compare the probability of finishing profitable, the median outcome, and the spread of ending results. An original backtest near the top of a wide distribution tells a different story from one close to the middle. The method guide explains how Resample differs from Shuffle.
Shuffle trade order
Shuffle reorders the same trades. With Random P&L variation set to zero, every run finishes at the same total. The path, drawdowns, and losing streaks can still change substantially.
Using the same example, −$50, +$200, and +$100 still end at +$250. Moving losses closer together can make the journey harder without changing the ending profit. In this mode, the summary reports Final net profit (every run). If P&L variation is enabled, trade amounts can change, so ending totals can differ too.
Vary trade outcomes
Simulation settings also let you adjust Random P&L variation. Zero keeps each trade’s original amount. Increasing it varies the outcome each time that trade appears in a replay.
Preserve win/loss is intended to retain whether a trade wins or loses while its amount varies. It is disabled when variation is zero. Treat variation as a way to explore sensitivity, not a guaranteed ±percentage range or a specific model of slippage and fills.
More runs generally make estimates less sensitive to random sampling. They do not add new historical evidence or fix assumptions in the underlying backtest.
Measure drawdown and risk of ruin separately
The drawdown controls offer 1.5× DD, 2× DD, 3× DD, and a custom multiplier relative to the original maximum drawdown. If that drawdown is $1,000, selecting 2× DD sets a $2,000 threshold. This changes the level being measured, not position sizing or trade losses.
P(drawdown ≥ threshold) reports the share of runs that reach or exceed the selected level. If 200 of 1,000 runs reach it, the probability is 20%.
Risk of ruin is a separate metric: the share of runs that lose all starting capital. Crossing the chosen drawdown threshold does not necessarily mean ruin. A displayed 0% ruin probability is not proof of zero real-world risk.
You can view drawdown in USD or percentage units. Percentage drawdown is measured from peak equity: falling from $12,000 to $9,000 is a $3,000 drawdown, or 25% of the peak.

Read the results beyond profit
The summary metrics help you compare both outcomes and the difficulty of reaching them:
- Probability of profit: the share of complete runs ending above zero, not the win rate of individual trades.
- Median outcome: the middle ending P&L across runs.
- P95–P99 drawdown: the 95th and 99th percentiles of maximum drawdown. The remaining tail can be worse; these are not guaranteed limits.
- P95 max losing streak: the 95th percentile of each run’s longest sequence of losing trades.
The Outcome Distribution groups runs by ending P&L. The Max Drawdown Distribution groups them by their worst peak-to-trough decline. Both offer histogram and cumulative views. Cumulative shows the share of runs at or below a value; the threshold probability instead counts runs that reach or exceed the chosen drawdown.
Streaks & Recovery compares actual, median, and P95 values. Max DD duration counts trades from the peak before the deepest drawdown to its trough. Recovery counts trades from that trough back to the prior peak. A run that ends underwater contributes only the trades it had left, so recovery figures are a lower bound.
Read the results in context
Simulation uses closed-trade P&L before commission, even where charts use the label “net profit.” Its closed-trade drawdown can differ from the Performance tab’s bar-by-bar figure. “Actual” means the original backtest, not live trading.
Use Trades Analysis to understand the trade statistics and Trades Log to inspect individual trades behind the result. Keep the symbol, timeframe, date range, and strategy settings consistent when comparing runs.
These simulations explore repeatability and sequencing risk within the observed trade history. They do not generate unseen market regimes or predict future returns. A favorable simulation cannot correct a weak backtest or account for every risk of live execution.
Explore your strategy’s alternative paths
Open Quant, review a backtest, and select Simulation. Start with zero P&L variation to compare trade selection and order, then explore how varying trade outcomes changes the results.
Read next