How to Trade Reversals using LuxAlgo Tools

A stretched price move is a reason to investigate a reversal, not proof that the trend is finished. A useful reversal process separates location, a defined signal, entry timing and the point at which the idea is invalid. Without those rules, an apparently attractive entry can become repeated attempts to fight the same trend.
Start your research on LuxAlgo’s native charts by defining the behavior you want to test. The specific Reversal Zones, HyperWave and OSC screener workflow below belongs to LuxAlgo’s separate TradingView toolkits. A native Quant strategy is not automatically an exact copy of those closed-source tools.
Why Extended Moves Can Keep Extending
A market can remain strong while an oscillator is overbought, or weak while it is oversold. News, changes in liquidity and persistent order flow can push prices beyond a familiar range. Do not assume that elevated volatility is always the current market regime or that a large move must immediately reverse.
Before looking for a countertrend entry, identify the instrument, session, broader context and events that could affect execution. Decide how much exposure the idea permits. An early entry may offer a small planned distance to invalidation, but a small planned stop does not guarantee a small realized loss during a gap or a poor fill.
Use Reversal Zones as Location Context
Reversal Zones display an upper and a lower area around price. Treat them as potential areas for investigating tops, bottoms or exits, and note that price can move outside them during increased volatility.
Enable the overlay and record its sensitivity. Define exactly what qualifies as a setup: for example, a touch, an excursion beyond a boundary, or a completed close returning inside. Those are different conditions. A touch alone is not a confirmed turn, and changing the definition after seeing the outcome makes the test unreliable.
Understand What HyperWave Turning Points Mean
HyperWave is a normalized adaptive oscillator. Main Length affects its smoothing. Its signal line can use an SMA or TS method, with a separate signal length. Record those choices because they change the resulting signals.
| Displayed event | Documented condition | Interpretation |
|---|---|---|
| Up turning point | HyperWave crosses above its signal line | An oscillator crossover, not proof of a price reversal |
| Down turning point | HyperWave crosses below its signal line | An oscillator crossover in the opposite direction |
| Oversold turning point | Cross above the signal line while HyperWave is below 20 | A larger turning-point marker in the oversold area |
| Overbought turning point | Cross below the signal line while HyperWave is above 80 | A larger turning-point marker in the overbought area |
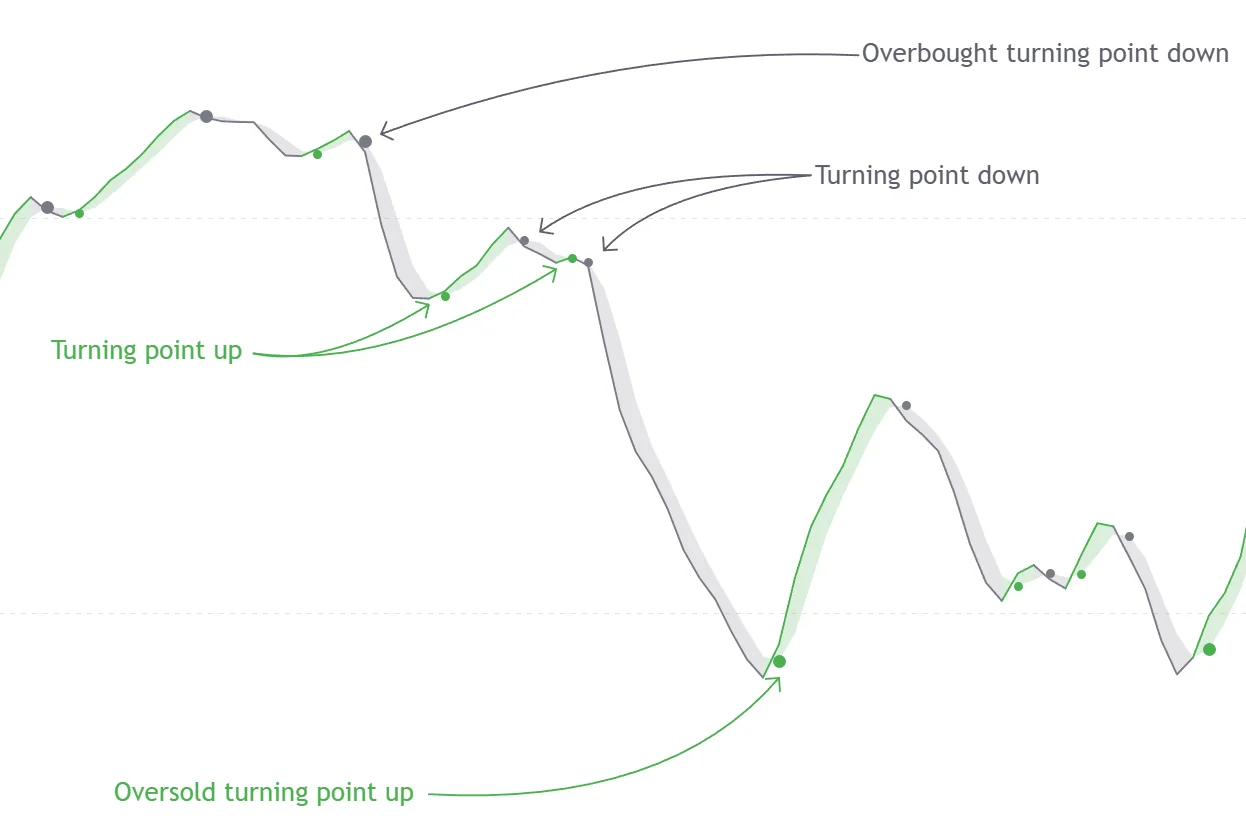
The TS method is a trailing-stop calculation applied to the oscillator’s signal line. It is not an instruction that places a protective order at your broker. Likewise, a green or red marker describes a condition in the tool, not a measured probability that the next trade wins.
If you add divergences, check when they were detected. The documentation says divergence lines placed on the price chart are positioned retrospectively. Their drawn location should not be treated as the time a trader first received the information.
Set Up the Screener for One Symbol Across Timeframes
The screener reports selected oscillator readings for up to 10 user-selected ticker/timeframe slots. It is a companion table, not a scan of every market or a watchlist, and each row can use the active chart ticker.
- Choose the symbol: use the active-chart ticker option for the rows you want to compare, or explicitly select the same symbol in each row. Verify the actual market/feed.
- Assign distinct intervals: choose a small set with a clear role for each. The original examples used 5, 10, 15 and 30 minutes plus one and two hours, or one, two, three and four hours plus daily and weekly. These are examples, not optimal settings.
- Focus the display: keep HWO Signal and any values required by your rules visible. Hide unused fields and record any filters or sorting.
- Match calculations: check HyperWave Main Length, signal method and signal length against the chart being used for decisions.
HWO Signal reports the most recent HyperWave signal. A row’s last signal can be old; it does not necessarily mean a new crossover occurred on the current bar. Several agreeing rows may also describe overlapping price information, not independent confirmations. Open the relevant chart and check timing before treating the table as an entry trigger.
Turn the Original Example into Explicit Criteria
The original illustration proposed an early bullish sequence while a slower row was still bearish. Read it as a candidate state pattern to test, not a complete trading strategy. The table below preserves those displayed states and adds the missing timing questions.
| Row | Illustrated entry state | Illustrated invalidation state |
|---|---|---|
| 1 hour | Oversold Up | Down |
| 2 hours | Up | Down |
| 3 hours | Up | Up |
| 4 hours | Down | Down |
Before testing that pattern, specify which zone condition must have occurred, the maximum age of each row’s signal, whether all conditions must coexist, and the decision candle. For a completed-bar rule, evaluate only information available when the relevant bars close. A higher-timeframe candle still in progress can change before its close.
For example, you might require a newly completed one-hour Oversold Up signal while the other selected rows meet your written conditions, then model entry at the next eligible opportunity. The exact zone rule, timing window and exit logic still need to be specified. Do not fill at an earlier price merely because the eventual chart looks favorable.
If your plan waits for the target timeframe to turn, define the actual event rather than saying “confirm trend shift.” A crossover satisfies a tool condition; it cannot establish that price will continue reversing. Test an opposite shorter-timeframe signal as an exit rule separately from a protective price-based stop, including which takes priority.
Define Invalidation Before Entry
A signal-based exit may arrive late, disappear while a bar is forming, or occur at an unfavorable price. Define the maximum planned exposure, any protective order, a time-based exit and what happens if data or execution is interrupted. Repeatedly entering because a market still looks extended can accumulate losses.
For a simple sizing illustration, a planned entry at $100 and invalidation at $98 creates $2 of price risk per share before costs. Ten shares have $1,000 of position value and $20 of planned price risk. Actual loss can exceed that amount if execution occurs below $98. Choose size from the account’s constraints; the example is not a recommended risk level.
Research, Record and Review with LuxAlgo
On LuxAlgo’s native charts, ask Quant, our coding agent to implement or explain a precisely defined reversal hypothesis. Inspect the generated code and run it manually. Do not assume it reproduces the proprietary TradingView toolkit calculations simply because you use the same feature names.
For native tests, check strategy settings for sizing, commission and slippage, and use standard candles. Review later periods, failures, drawdowns and the number of trades as well as favorable examples. Native research and the TradingView setup should retain their own documented data and calculation assumptions.
Save a baseline and keep related experiments organized. The workspace demonstration below shows organization, not automated execution. Review compatible recorded trades in the native journal and compare actual decisions with the written rules.
The purpose of a systematic process is to make decisions reproducible and assessable. It does not remove uncertainty or guarantee an improved success rate. Community examples in LuxAlgo’s Discord can provide ideas to investigate, but they still need independent testing and complete rules.
Frequently Asked Questions
Does touching a Reversal Zone confirm a reversal?
No. A zone identifies a potential area to investigate. Price can continue through it, so define the signal, entry, invalidation and sizing separately.
What creates a HyperWave turning point?
A cross between HyperWave and its signal line creates a turning point. The documented oversold variant crosses above while below 20; the overbought variant crosses below while above 80.
Does HWO Signal mean a new signal just appeared?
Not necessarily. The screener reports the most recent HyperWave signal for that row. Check its age and the relevant chart before using it as a fresh trigger.
Can the OSC screener scan every market?
No. It reports selected information for up to 10 user-selected ticker/timeframe slots in its TradingView environment.
Will Quant reproduce the TradingView toolkit exactly?
Do not assume so. Define a native research hypothesis, inspect the generated code and run it manually. Proprietary toolkit calculations and native scripts are separate implementations.
Read next