Concept
SMA
SMA, also known as simple moving average, is a Trend concept. The Library holds 3 implementations, each one a working definition you can pull into Quant.
Top SMA indicators
The top custom implementations, built on the original standard SMA formula.
3 total
From studying SMA to trading it: take any implementation below into Quant and backtest it instantly.
.png&w=3840&q=75)
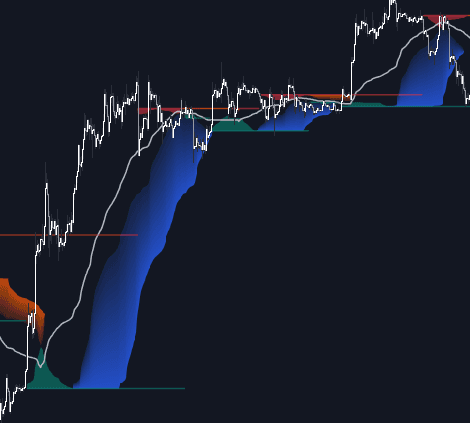
The standard SMA indicator
SMA exactly as classically defined: the faithful reference build of the original formula, free to run in Quant.
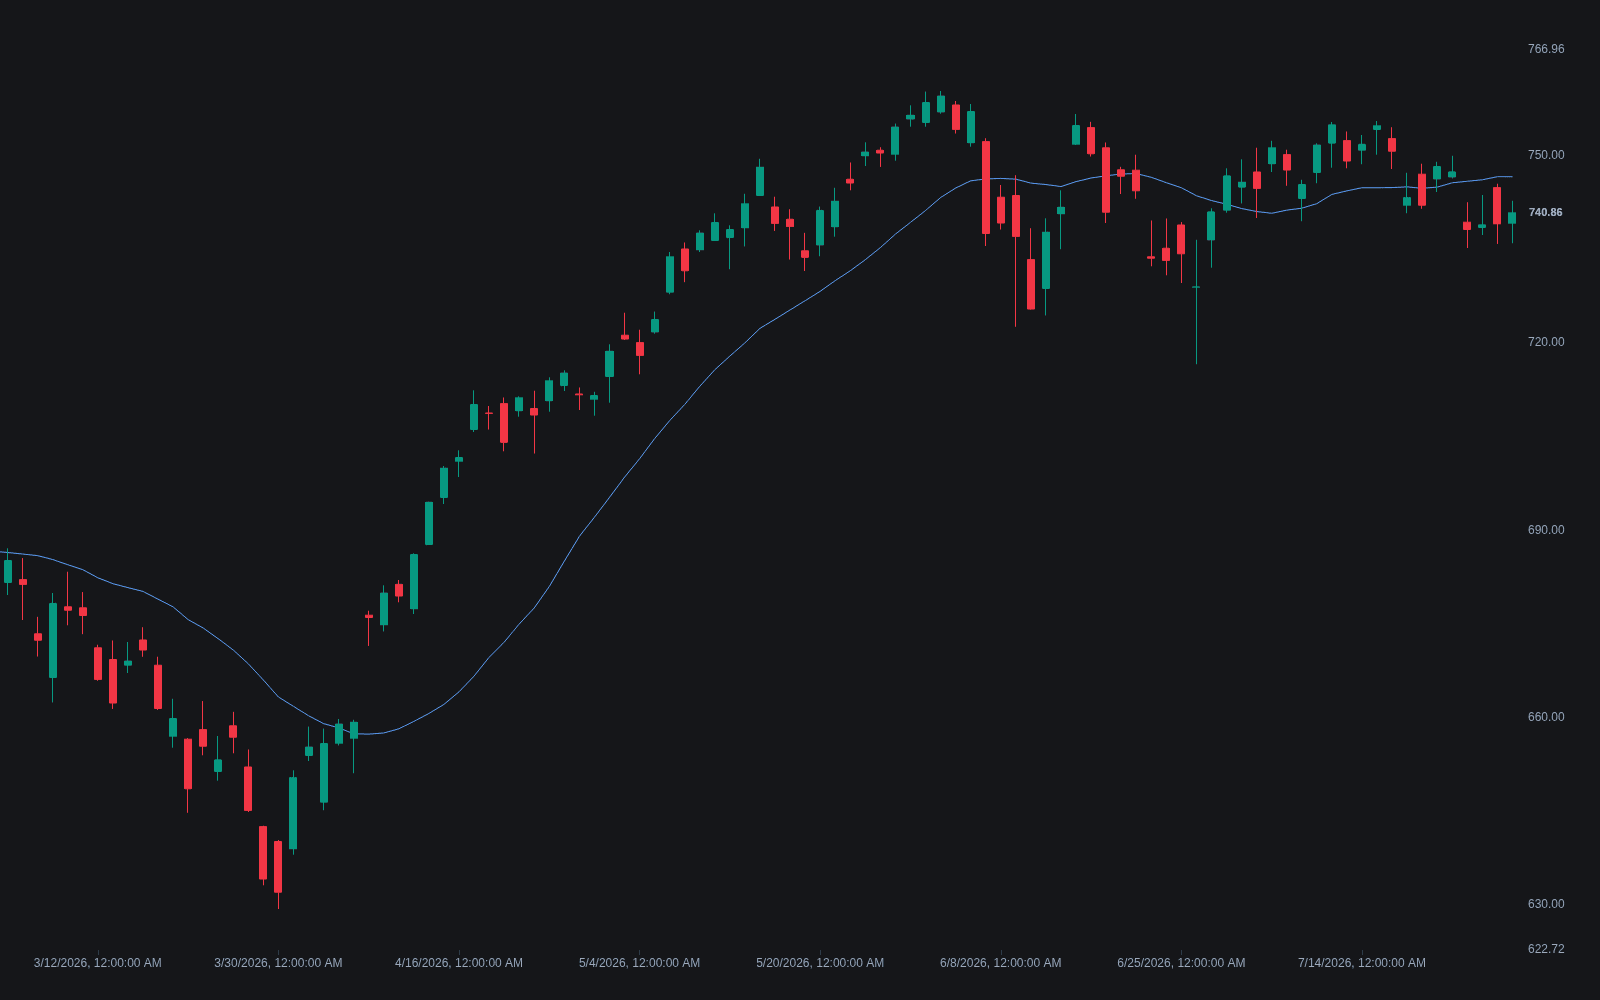
What is an SMA?
A simple moving average (SMA) is the arithmetic mean of the last N values of a series, usually closing prices, recomputed on every bar. Each of the N bars carries identical weight, one part in N, so the line smooths bar-to-bar noise into a single trend estimate. The cost of that smoothing is lag: on a steadily trending series the SMA runs roughly half its window length behind price.
Equal weighting gives the SMA one quirk worth knowing: the drop-off effect. The oldest bar exits the window on every new bar, so a single extreme value from N bars ago can move today's average even while current price sits still. Equal weighting is also what the rest of the moving-average lineage exists to change: the EMA shifts weight toward recent bars, and faster designs such as the HMA push further, each trading noise suppression against lag differently.
The SMA matters because it is the reference smoother of technical analysis. The 200-day SMA is among the most watched trend benchmarks in any market, the golden cross and death cross are defined on SMA pairs, and Bollinger Bands build on a 20-period SMA basis. Because so many participants watch the same lines, widely used SMAs can behave like self-reinforcing reference levels, though nothing obliges price to respect them.
How to calculate an SMA
The calculation is a rolling arithmetic mean. Every charting platform automates it, but the mechanics matter for reading the line correctly.
- 1Choose a source and a length. Close is the standard source; common lengths are 20 for short-term work, 50 for intermediate, and 200 for long-term context.
- 2Sum the last N source values and divide by N. That quotient is the SMA value plotted on the current bar.
- 3Advance one bar: the newest value enters the window, the oldest drops out, and the mean is recomputed. The plotted line connects these rolling means.
- 4Read it through slope and position: price holding above a rising SMA is trend-following evidence for longs, price below a falling SMA is the mirror case, and a flat SMA with price whipping across it marks a range where the average carries little information.
How it's calculated
The equal-weighted arithmetic mean of the last n prices, recomputed each bar.
Every bar carries the same weight 1/n, so on a steady trend the SMA lags price by about (n - 1) / 2 bars.
It is defined only once n bars exist; platforms leave earlier bars empty or average the shorter window.
Close is the standard input, but any series can be averaged (open, median price, even another indicator).
How traders use it
- As a trend filter: price above or below a long SMA (the 200-day is the classic) gates which direction a system is allowed to trade, the same role a higher-timeframe trend filter plays across timeframes.
- As a crossover engine: a fast SMA crossing a slow one defines moving average crossovers, including the 50/200 golden and death crosses used as slow regime signals.
- As dynamic support and resistance: widely watched SMAs often see reactions on a first touch (dynamic S/R via MA), though a touched average holds only as often as the trend behind it does.
- As a building block: the 20-period SMA is the default basis of Bollinger Bands, and SMAs at stepped lengths form MA ribbons and envelopes that read trend alignment at a glance.
SMA vs neighboring averages
EMA: Both smooth price, but the EMA applies exponentially decaying weights, so it hugs recent price and turns earlier. The SMA weights all bars equally, which makes it smoother, slower, and subject to old bars dropping out of the window.
WMA: The WMA weights bars linearly, newest heaviest and oldest lightest, so recent action dominates and the line turns sooner than an equal-length SMA. The SMA is the flat-weight special case and the slowest of the family to reflect the newest bar.
VWMA: The VWMA weights each bar by its volume rather than its recency, so heavy-volume bars pull the average toward their price. The SMA treats a quiet bar and a climactic bar identically.
LSMA: The LSMA fits a linear regression through the window and plots its endpoint, an estimate of where the trend says price should be now. The SMA plots the window's mean, which sits near the middle of a trending window rather than its leading edge.
Concept family
Trend
100 concepts mapped · 100 in the Library
SMA FAQ
Turn SMA into a trading strategy.
Take any implementation from this page into Quant, then build on it, backtest it on real data, and keep refining it in conversation.