Steve Cohen's Trading Rules — Best Risk Reward Insights

The most useful lessons from studying Steve Cohen are about research, risk oversight and adapting decisions to evidence. They should not be reduced to a supposedly universal position-sizing formula or a promised return. Precise rules attributed to a prominent investor need a reliable source before they become part of your trading plan.
Point72’s biography records that Cohen founded S.A.C. Capital Advisors in 1992 and converted his investment operations to the Point72 family office in 2014. The firms and time periods should not be treated interchangeably when discussing later trading activity.
This guide uses documented Point72 risk practices as context, then develops practical examples for individual traders. The calculations and LuxAlgo workflows below are educational applications, not disclosures of Cohen’s personal positions or proprietary rules.
- Research the thesis: understand the business, catalyst and evidence that would change your view.
- Measure several kinds of exposure: position value, planned loss, liquidity, leverage and shared portfolio risks are different measures.
- Define what happens when risk changes: distinguish a warning that needs review from a limit that requires action.
- Test and review: use Vela, our next-generation charting platform, and Quant to investigate explicit rules, then compare them with actual trading outcomes.
Steve Cohen’s Risk Management: What Is Documented?
A September 2023 disclosure from Point72 Europe (London) LLP describes a fundamental-research-intensive long/short equity approach and group-level portfolio oversight. It identifies reviews of value at risk, stress tests, market beta, large positions and illiquidity. The document also distinguishes flags, guidelines and hard limits, with escalating responses when thresholds are crossed.
That is evidence of a layered risk process at the date of the disclosure. It does not establish a public “5-2-1” rule limiting every stock to 5%, every sector to 20% and gross exposure to 100%. Nor does it substantiate fixed VIX-based leverage bands or a universal options open-interest threshold. Treat those numbers as unverified attributions rather than Cohen’s published instructions.
Trading Liquid Assets
Liquidity affects whether an entry or exit can be executed near the intended price. Review bid-ask spreads, available size, typical turnover, trading hours and the size of your order relative to the market. A high daily volume total does not guarantee liquidity during an earnings surprise or a trading halt.
For example, a stock quoted at $49.95 bid and $50.05 ask has a $0.10 spread. Buying 100 shares at the ask and immediately selling at the unchanged bid loses $10 before commissions. Larger orders can cost more if they consume available liquidity or move the market. This is an invented execution example, not a Cohen trade.
For options, inspect the exact strike and expiry, quoted spreads and available size. Open interest counts outstanding contracts; it is not a guarantee of an executable quote. Futures require attention to contract size, expiry and rolling liquidity. Avoid using one fixed volume or open-interest threshold across all instruments.
Managing Leverage and Volatility
Leverage magnifies the effect of price changes on account equity. In a simplified account with $100,000 equity, $200,000 of long stock and $100,000 borrowed, a 10% stock decline reduces the holdings to $180,000. The debt remains $100,000, leaving $80,000 equity: a 20% equity loss before interest and costs.
Investor.gov’s margin guide explains that losses can exceed deposited funds and brokers may liquidate positions without advance notice. Available buying power is therefore different from a suitable risk budget.
Cboe’s VIX documentation describes expected 30-day S&P 500 volatility derived from options. VIX is useful market context, but it does not forecast the direction or maximum loss of a particular stock. A stock-specific event can create substantial risk even when VIX is low.
Review leverage alongside the portfolio’s stress losses, liquidity, financing and concentration. Predetermine how a breach changes new orders and existing exposure. A simple rule such as “reduce size when volatility rises” still needs an explicit measurement, threshold and execution plan before it can be tested.
Position Size Control
Separate the cash committed to a position from the loss planned at an exit. A 5% portfolio allocation is not the same as risking 5% of account equity. Likewise, several individually small positions may share the same sector or market exposure.
| Measure | Question it answers | Limitation |
|---|---|---|
| Single-position value | How much capital or notional exposure is in one instrument? | Does not capture volatility, gaps or derivatives sensitivity |
| Sector and factor exposure | Which holdings depend on similar business or market conditions? | Relationships can change during stress |
| Gross and net exposure | How large are total positions and their directional balance? | Offsetting dollars do not necessarily offset risk |
| Planned trade loss | What would the position lose at the specified exit? | The exit price is not guaranteed |
For a simple stock position, shares = dollar risk budget / absolute entry-to-stop distance, rounded down and adjusted for costs and other limits. Convert an account-risk percentage to dollars first. This is fixed-risk sizing, not the Kelly criterion, which uses estimated outcome probabilities and payoffs.
Assume a hypothetical $100,000 account, a 2% planned risk budget, a $100 entry and a $90 stop. The calculation gives $2,000 / $10 = 200 shares, worth $20,000 at entry. If a separate policy caps that stock at 5% of equity, it permits only $5,000, or 50 shares. The stricter constraint controls the trade. None of these percentages is a universal recommendation or a documented Cohen limit.
If the 200-share position gaps to an $80 exit, the loss is $4,000 before costs, not $2,000. Stress testing should include that possibility rather than treating the stop-based calculation as a maximum loss guarantee.
Risk-Reward Analysis Methods
Combining Technical and Fundamental Analysis
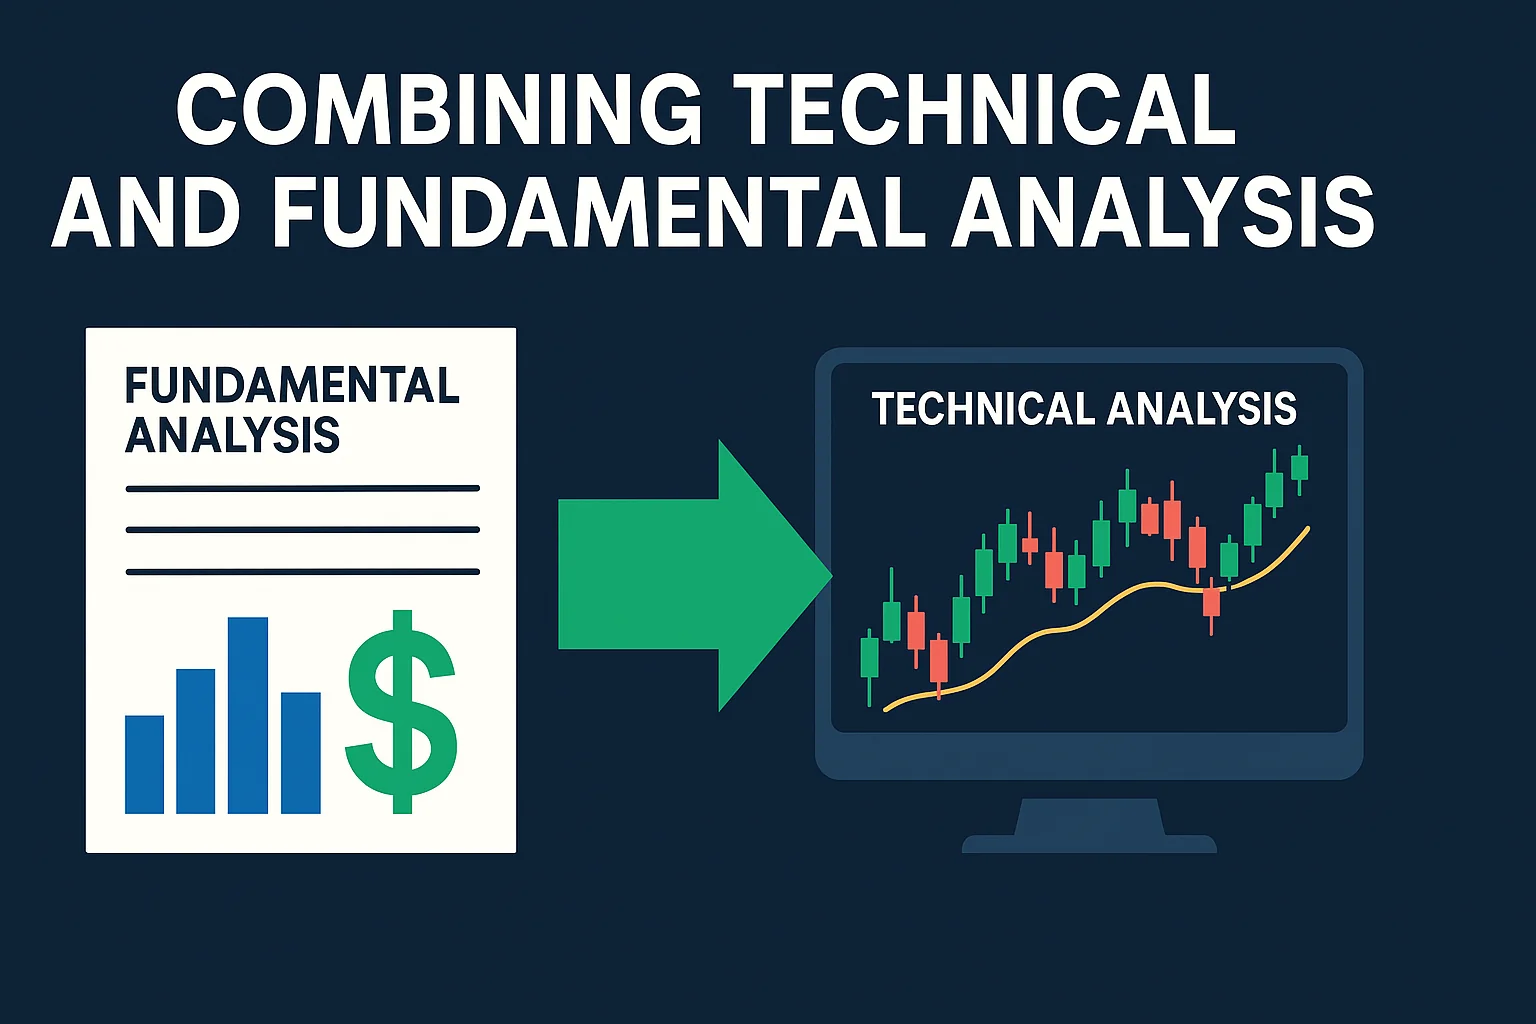
Fundamental research asks whether earnings, cash flows and competitive conditions support the price. Technical analysis describes price behavior and can turn a timing idea into a testable rule. Neither automatically confirms the other.
| Research layer | Useful inputs | Decision to document |
|---|---|---|
| Business fundamentals | Revenue, margins, balance sheet, competition and valuation | What is the thesis, and what would invalidate it? |
| Price and volume | Trend, support, volatility and trading activity | What exact event triggers an entry or exit? |
| Events and expectations | Earnings dates, policy announcements and what appears priced in | What could cause a gap or change the thesis? |
A strong company can still be an unattractive trade at the wrong price. An upward chart can coexist with weakening fundamentals. State which evidence governs the decision when the signals conflict, and preserve the information available at that time.
Evaluate Reward Together with Probability
A long entry at $50, planned stop at $47 and target at $56 offers $6 of potential reward for $3 of planned risk: a 2:1 reward-to-risk relationship. The target is a scenario, not money already earned.
With a hypothetical 40% win rate, $6 average gain and $3 average loss, expectancy is 0.40 × $6 − 0.60 × $3 = $0.60 per share before costs. At a 30% win rate it becomes −$0.30. A favorable-looking target distance alone cannot establish an edge. Use realized average wins and losses when reviewing performance, including early exits and gaps.
Choose Exits That Match the Thesis
- Price-based invalidation: exit when a defined technical or fundamental premise no longer holds.
- Volatility-based exits: use a specified volatility measure and multiplier, then size the position consistently with the resulting distance.
- Time-based exits: close or reassess when the expected catalyst or follow-through has not occurred within a defined window.
These are general methods rather than verified descriptions of Cohen’s personal stops. Investor.gov distinguishes stop orders, which become market orders when triggered, from stop-limit orders, which may not fill. A plotted trailing-stop level is not an order at a broker.
Video: Trading Lessons Associated with Steve Cohen
This UKspreadbetting commentary discusses lessons associated with Cohen. It is a third-party interpretation, not a Cohen interview or a disclosure of Point72’s current risk limits. Evaluate its lessons alongside the primary-source distinctions above.
High-Level Risk Control
Look Beyond the Individual Trade
Imagine three $10,000 positions exposed to the same demand cycle. If each declines 15% in the same scenario, the combined loss is $4,500. Splitting the exposure across three tickers has not removed the shared risk.
For a simple cash-equity portfolio, $120,000 long and $80,000 short against $100,000 equity means 200% gross exposure and 40% net exposure. Low net exposure can still hide substantial leverage, stock-borrow costs and mismatched risks. Options and other derivatives require additional exposure measures.
When volatility or correlations rise, evaluate the whole account before adding or resizing a trade. If a justified stop distance doubles while the dollar loss budget remains fixed, the calculated share count halves. Widening the stop while leaving the quantity unchanged doubles the planned loss.
A practical review can distinguish a warning to investigate, a position reduction required by your policy, and a hard limit that blocks new risk. Record who or what acts, how quickly, and what happens if market conditions prevent the intended execution. This adapts the idea of escalating controls without pretending to reproduce an institutional risk system.
Trading Tools for Risk Management
Build a Research Workflow on LuxAlgo
Use Vela to inspect the intended symbol, timeframe and session. The Watchlist’s advanced view brings price, financial and news information into the research process. Keep a separate note of the thesis, event date and acceptable exposure before a signal appears.

Ask Quant, our coding agent, to implement explicit rules. For example, specify a completed-bar entry condition, an initial stop, a time exit, no pyramiding and a fixed sizing method. Review the Code, run the strategy on the intended chart, and set commission, slippage, capital and order size in the simulation properties.
Inspect the backtest summary and Trades Log for the actual simulated fills. Confirm that the code uses information available at the decision time, and test on a later period that was not used to choose the settings. A generated script or an attractive profit factor does not independently validate a strategy.
Separate Analysis, Alerts and Execution
A research indicator, a strategy simulation, an alert and a broker order perform different jobs. Do not assume that saving a Quant strategy creates live orders, account-wide position limits or automatic stop execution. Any separate automation needs explicit rules, supported connections and verification of what happens when an order is rejected or a connection fails.
Keep the response to a risk breach simple enough to test: what is measured, which threshold triggers action, what action is intended, and how you confirm it happened. Automation can enforce a flawed rule as consistently as a sound one.
Use Order Flow and Trade Review as Context
LuxAlgo volume profiles and footprints can help inspect trading activity where supported. The data documentation explains that footprints summarize executed volume at price; they are not an order book. U.S. equity data comes from Cboe EDGX and does not represent consolidated market volume. A volume imbalance does not guarantee the next price move.
Use the Journal to review recorded fills and notes. Compare planned size, actual execution, fees, exits and the reason for any deviation. Look for repeated process mistakes across the full sample, not just a few large winners.
Applying the Lessons
The practical goal is a research process with explicit limits and honest feedback. Develop expertise in the markets you trade, define what would change your mind, size for adverse outcomes, and review the actual results. Cohen’s reputation and Point72’s institutional resources do not make any retail rule or tool a guarantee of consistent returns.
FAQs
What is Steve Cohen's '5-2-1' rule, and how does it help manage portfolio risk?
The primary sources cited here do not establish a Cohen rule limiting a stock to 5%, a sector to 20% and gross exposure to 100%. Treat that attribution as unverified. Position, sector and gross-exposure limits can still be useful, but they should be defined for the strategy and kept distinct from a planned loss budget.
How does Steve Cohen adjust leverage based on market volatility?
Point72’s September 2023 disclosure describes portfolio risk monitoring, stress tests and escalation of risk controls, but does not substantiate the fixed VIX-based leverage bands sometimes attributed to Cohen. For an individual strategy, assess volatility alongside liquidity, concentration, financing and stress losses rather than assuming one VIX threshold makes leverage safe.
How can modern trading tools and automation support Steve Cohen's approach to risk management?
Charts, research tools and backtests can help make decisions explicit and testable. Quant can help write strategy code, and the Journal can support reviewing recorded trades. These tools do not independently validate an investment thesis or enforce broker-level risk limits; any alerts or execution automation must be separately configured and checked.
Read next