Periodic Linear Regressions
 By LuxAlgoSep 25, 2024
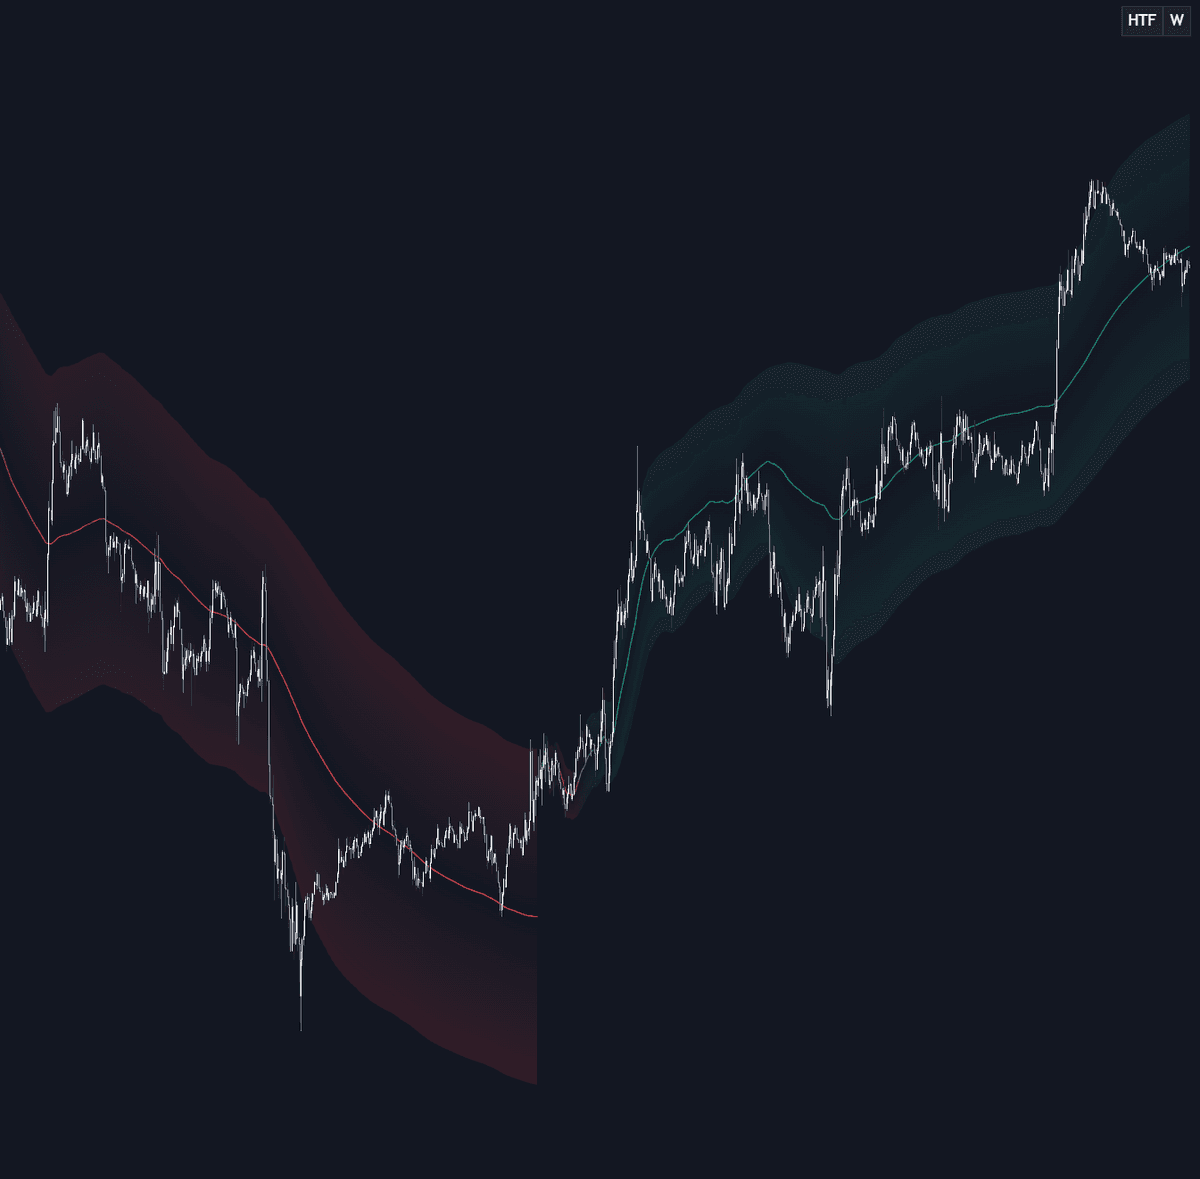
Periodic Linear Regressions fits a linear regression to price over each anchor period and resets when a new period begins: anchored calculation in the spirit of periodic VWAPs, applied to best-fit lines. Optional extremities scaled by the root mean squared error between price and the fit surround it with a linear regression channel, turning a slope estimate into usable support and resistance.
How to Trade the Periodic Linear Regressions?
- Slope color: with Bicolor enabled, green marks an upward fit and red a downward one, an immediate per-period regime read.
- Price at an extremity: the RMSE bands mark the channel's edges, most useful inside ranges and channels.
- Static line's angle: the straight fit shows how linear the period's trend has been and hints at its continuation.
- Anchor marks: flag where each new calculation period begins.
Two mechanical notes: a regression needs at least two points, so the static line cannot exist on a period's first bar and the rolling line starts plotting on the third; and the static line re-fits (and may repaint) until its period ends, while the rolling line extends from previously calculated points.
Periodic Linear Regressions Settings
- Method: "Static" draws the period's straight best-fit line; "Rolling" plots the evolving endpoint of successive fits.
- Anchor Type: "Periodic" resets each Anchor Period; "First Bar" runs one calculation from the start and works exclusively with Rolling.
- Anchor Period: the reset interval for periodic anchoring.
- Source: the input series being fitted.
- Multiple: scales the distance of the RMSE extremities.
- Show Extremities: toggles the upper and lower bands.
- Color, gradient (Rolling only), and dashboard location/size options handle presentation.
Frequently Asked Questions
Free indicator
Get free access to this indicator on the platforms below.

The Library is free. Quant makes it yours.
Pull any concept or indicator into Quant: rebuild it, retune it, or turn it into a backtested strategy of your own.