VWAP
 By LuxAlgoApr 13, 2020
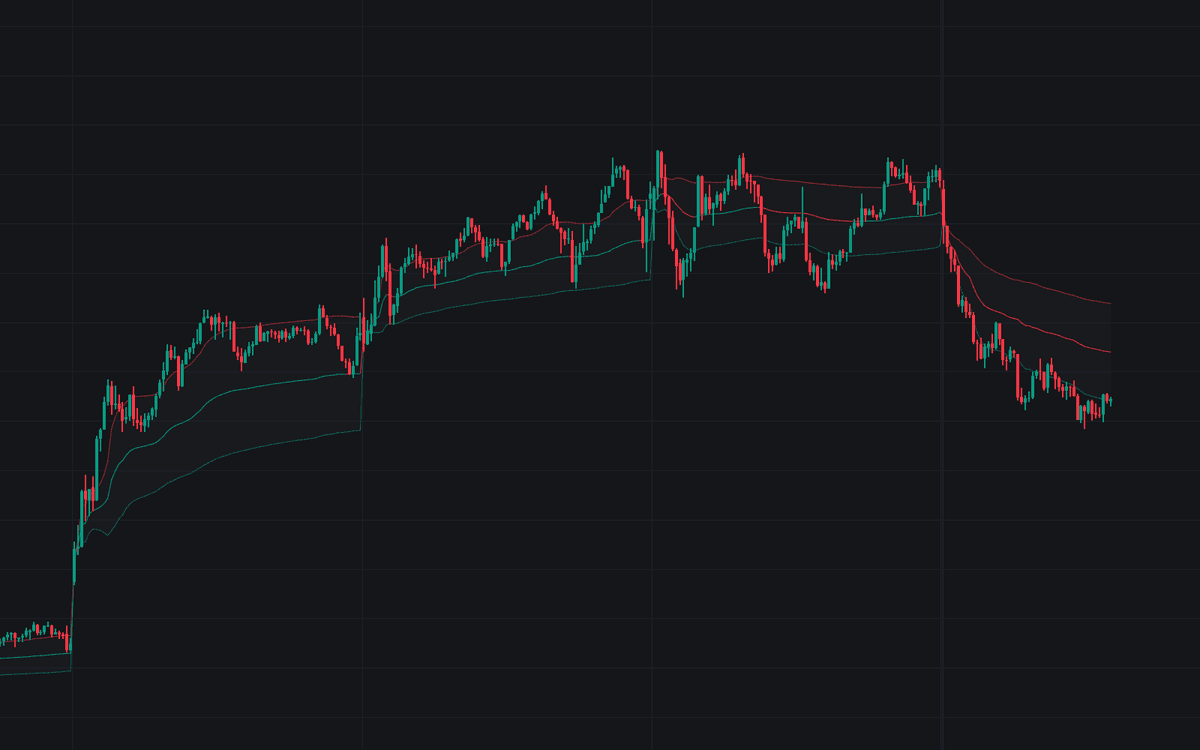

The VWAP indicator computes the volume-weighted average price of a session, summing each bar's price multiplied by its volume and dividing by the cumulative volume from the anchor point, then resetting when a new period begins. The anchor defaults to the trading day, with week and month options, and bands can be toggled at plus or minus 1, 2, and 3 standard deviations (or fixed percentages) around the VWAP line. This is the standard, raw implementation of session VWAP with no modifications.
Volume does the weighting: busy bars pull the line far harder than quiet ones, one reason the level is watched so closely intraday.
How to Trade the VWAP?
- Price above the VWAP: the period's average fill sits below price, an intraday bias many traders require before longs.
- Price below the VWAP: sellers control the period's average; rallies into the line are candidate fades.
- Crosses of the VWAP line: a shift of intraday control, unreliable in thin tape without follow-through.
- Touches of the outer bands: often rotate back toward the line in balanced sessions; riding a band marks a one-sided trend.
VWAP Settings
- Anchor Period (default Session): where the calculation resets, at the first bar of each trading day, week, or month.
- Source (default hlc3): the price entering the weighted average.
- Bands Mode (default Standard Deviation): deviation or fixed-percentage band offsets.
- Band #1 (default on, multiplier 1.0), Band #2 (default off, 2.0), Band #3 (default off, 3.0): toggle each pair and set its distance.
- Hide VWAP on 1D or Above (default on): hides the plot on daily and higher timeframes.
- Bands Fill (default on): shades the area between each visible band pair.
VWAP Alerts
Two alert conditions track the line: Price Crossed Above VWAP and Price Crossed Below VWAP, firing when the close crosses the running average.
Frequently Asked Questions

The Library is free. Quant makes it yours.
Pull any concept or indicator into Quant: rebuild it, retune it, or turn it into a backtested strategy of your own.