Concept
Linear Regression
Linear Regression, also known as slope/intercept/forecast, R², is a Statistics concept. The Library holds 8 implementations, each one a working definition you can pull into Quant.
Top Linear Regression indicators
The top custom implementations, built on the original standard Linear Regression formula.
8 total
Every Linear Regression implementation here is strategy-ready: open one in Quant, set your rules, and it backtests automatically.
.png&w=3840&q=75)
What is Linear Regression?
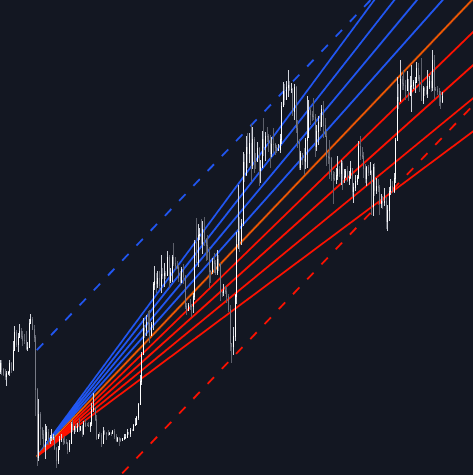
Linear regression fits a straight line through the last N bars of price by ordinary least squares. With the bar index as the input and price (usually the close) as the output, it chooses the slope and intercept that minimize the sum of squared vertical distances between the line and price. The result is a best-fit line through the middle of the window, summarized by its slope (the fitted change per bar), its intercept, and its value at the most recent bar.
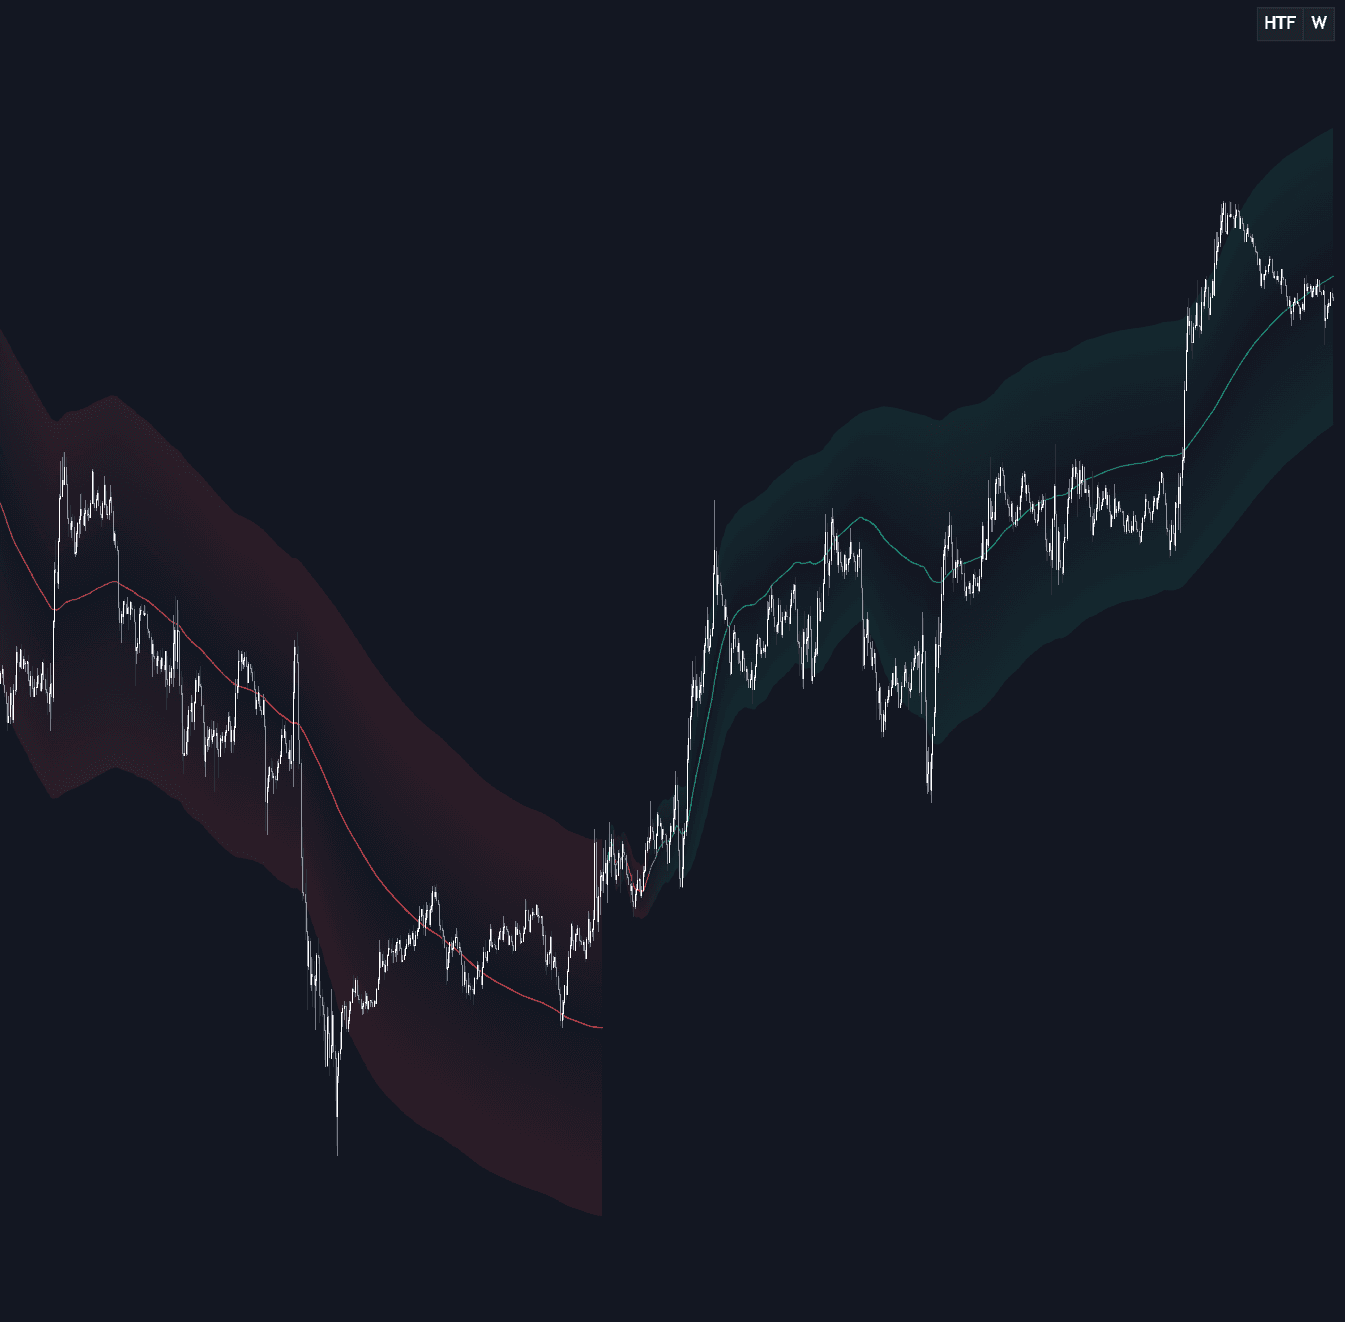
Three readings fall out of one fit. The slope is a computed trend measure: its sign gives direction, its magnitude gives velocity. The fitted value at the newest bar, recomputed as the window rolls forward, traces the LSMA (least squares moving average); projected one bar ahead, it is often called a time series forecast. R², the squared correlation between price and time over the window, scores how much of the price variance the line explains, a common trend-quality proxy. The residuals around the line seed linear-regression channels and standard-error channels.
It matters because it swaps an eyeballed line for a computed one. A hand-drawn trendline depends on which swings you connect; the least squares line is identical for anyone using the same window and source, which is why regression slope and R² sit inside many trend filters and regime classifiers. The trade-off is window sensitivity: change the lookback and the line, slope, and forecast all change, and the fit assumes a linearity markets only deliver some of the time.
How to calculate Linear Regression
The fit is deterministic: given a window and a source series, ordinary least squares produces exactly one line, so any two platforms with the same inputs draw the same result.
- 1Pick a window and a source. Choose a lookback of N bars and a price series, typically closes. Number the bars 1 through N as the x values; the prices are the y values.
- 2Fit by least squares: the slope equals the covariance of x and y divided by the variance of x, and the intercept equals the mean of y minus the slope times the mean of x. This is the unique straight line that minimizes the sum of squared vertical distances to price.
- 3Read the outputs: the line's value at the latest bar is the regression value (the current LSMA value), the slope is the fitted change per bar, and R² (the squared correlation between price and time) grades the fit from 0 to 1.
- 4Refit every bar: when a new bar closes, the window shifts and the entire line is recomputed, so anchored drawings such as regression channels redraw over history while the endpoint series simply extends by one value.
How it's calculated
The least-squares straight line fitted to price over a lookback window, giving a slope, an endpoint value, an optional forecast, and a fit quality score.
For a single-variable fit, R^2 equals the squared Pearson correlation between the x_i and y_i.
Regression channels add parallel lines offset from the fit by a multiple of the standard deviation of the residuals, or by the maximum deviation.
The plotted value is recomputed over a moving window each bar, so the line on the chart curves even though each fit is straight.
How traders use it
- As a trend filter: the sign and size of the regression slope give a computed direction read, often normalized by ATR or expressed as a percentage so thresholds transfer across symbols and timeframes. It plays the same role as an MA slope filter, with less endpoint lag than an SMA slope of the same length.
- As a low-lag average: plotting each rolling window's endpoint produces the LSMA, which turns faster than an SMA of the same length at the cost of more overshoot in chop.
- As a trend-quality gate: R² near 1 marks windows a straight line describes well, while values near 0 mark sideways noise. Many trend/range classifiers only take directional setups when slope and R² agree.
- As a mean-reversion frame: residual bands around the line (a multiple of the standard deviation or standard error) mark stretched excursions, and the gap between price and the one-bar-ahead regression forecast is the basis of the Chande Forecast Oscillator. Extrapolating the line forward assumes the drift persists, which is not guaranteed.
Linear Regression vs related concepts
Trendline: A trendline is drawn through swing highs or lows and acts as a boundary price reacts to; a regression line is computed through the middle of the data and acts as a trend axis. One is a discretionary level, the other is a fit.
LSMA: The LSMA is the time series of regression endpoints, one value per bar, used like a moving average. Linear regression proper is the whole fitted line over one window, with slope, R², and residuals attached.
Linear-regression Channel: The channel takes a single fitted line over an anchored window and adds parallel bands a set number of standard deviations or standard errors away. Regression is the fitting step; the channel is one drawing built on top of it.
Polynomial Regression: Polynomial regression fits a curve of degree 2 or higher instead of a straight line, so it can bend with the data. The flexibility tracks turns better in-sample but overfits more easily and swings harder at the endpoints.
More Linear Regression implementations
Concept family
Statistics
46 concepts mapped · 46 in the Library
Linear Regression FAQ
Turn Linear Regression into a trading strategy.
Take any implementation from this page into Quant, then build on it, backtest it on real data, and keep refining it in conversation.