Correlation Trend Indicator
 By LuxAlgoJul 22, 2026
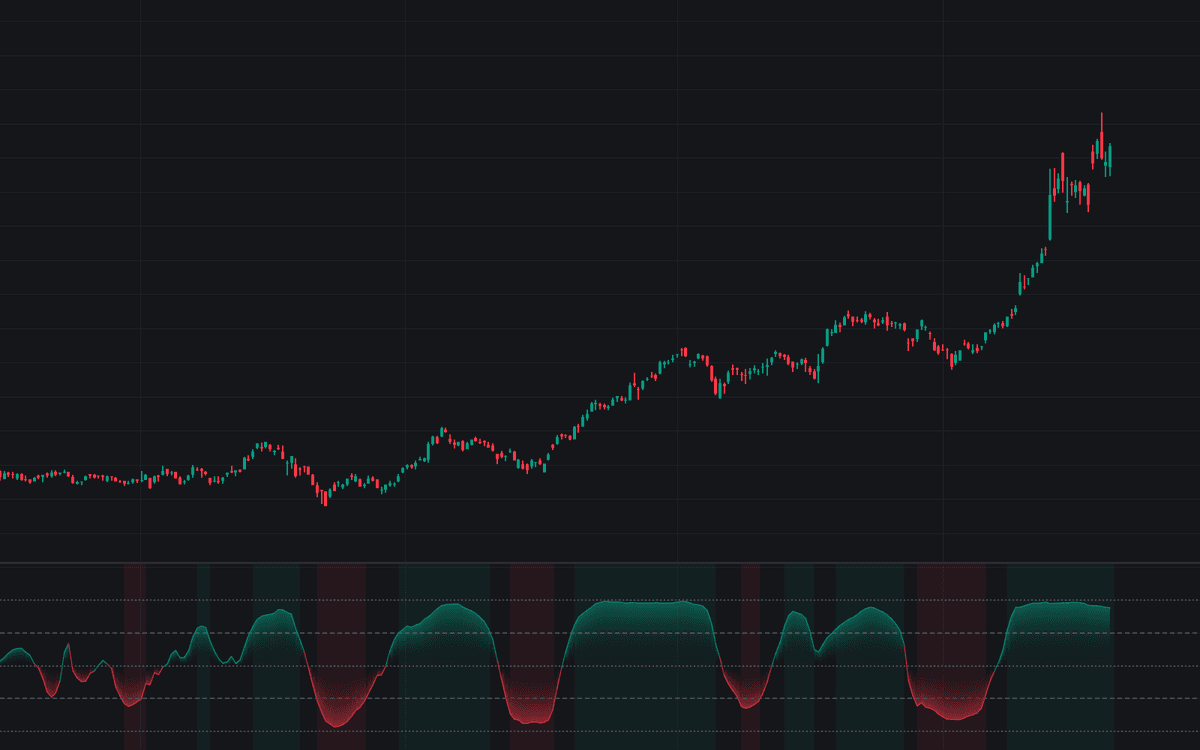

Correlation Trend Indicator scores how closely the recent window of price resembles a straight line, implementing the Correlation Trend Indicator exactly as defined: a Pearson correlation computed over 20 bars between the source and an ideal rising line. Readings near +1 mean the window tracked a steady advance, readings near -1 a steady decline, and the plot flips color at zero with a gradient fill toward the reading. Dashed thresholds at plus and minus 0.5 and dotted bounds at plus and minus 1 frame the scale.
How to Trade the Correlation Trend Indicator?
- Above the Trend Threshold (+0.5): a bullish trend regime. The background tints, marking stretches where trend-following logic applies.
- Below -0.5: the bearish mirror; regime alerts fire on entry to either state.
- Inside the threshold band: a trendless window. The regime background clears and a dedicated alert marks the return to neutral.
- Zero crosses: sign changes arrive after the turn, lagging by a fraction of the window; optional circles mark them on the zero line.
As a bounded, scale-free regime gauge it slots cleanly into the trend family.
Correlation Trend Indicator Settings
- Length (default 20): lookback correlated against the ideal rising line; it sets the trend scale being measured; other lengths score other swings and need not agree.
- Source (default close): the series being scored.
- Trend Threshold (default 0.5): magnitude treated as a meaningful trend; the regime states and their alerts key off it.
- Regime Background (default enabled): tints the pane while the reading holds beyond the threshold.
- Zero Cross Markers (default disabled): circles at sign changes; the cross alerts fire either way.
Frequently Asked Questions

Original indicatorBuilt in-house by LuxAlgo
The Library is free. Quant makes it yours.
Pull any concept or indicator into Quant: rebuild it, retune it, or turn it into a backtested strategy of your own.