Concept
Correlation Trend Indicator
Correlation Trend Indicator is a Trend concept. The Library holds 1 implementation, a working definition you can pull into Quant.
Ehlers CTI
Top Correlation Trend Indicator indicator
The top custom implementation, built on the original standard Correlation Trend Indicator formula.
1 total
The Correlation Trend Indicator implementation below can become a backtested trading strategy — describe your rules and Quant writes the code.
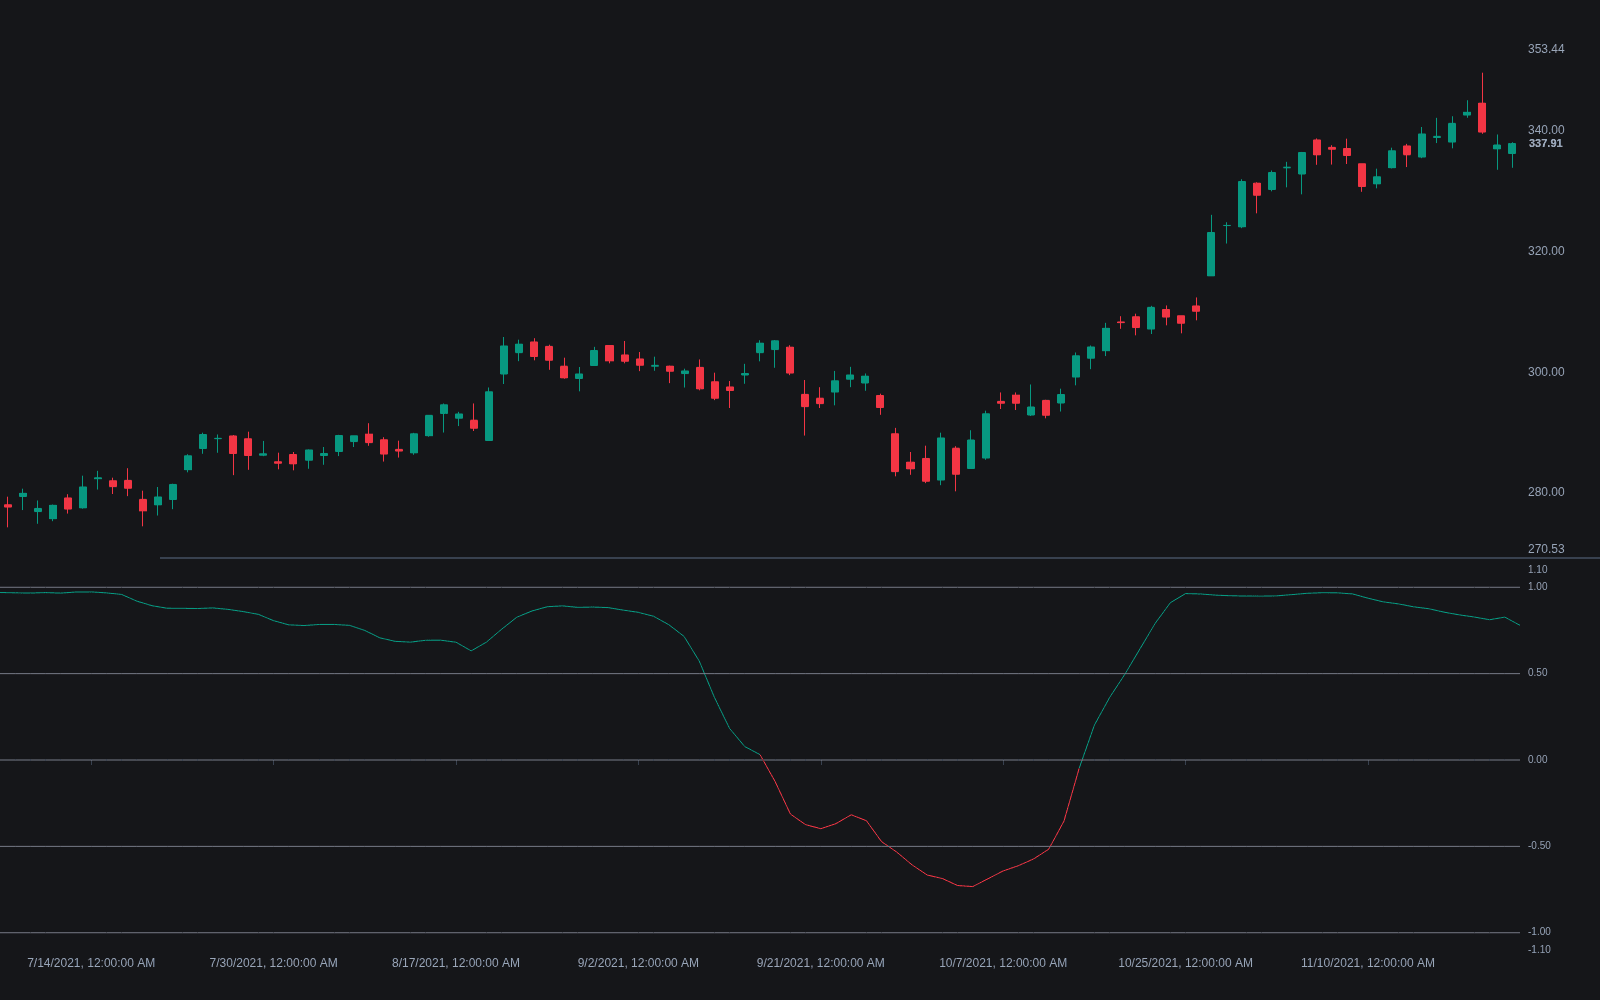
What is the Correlation Trend Indicator?
The Correlation Trend Indicator (CTI) is John Ehlers' answer to a deceptively simple question: how much does recent price look like a straight line? Introduced in 2020, it computes the Pearson correlation between price and an ideal rising line over a lookback window. The output lives between -1 and +1: readings near +1 mean price has tracked a steadily rising line, readings near -1 mean a steadily falling one, and readings near zero mean the window contains no linear drift worth the name.
The elegance is that trend is defined by fit rather than by displacement. A market can be far above an old level yet trending badly (one gap followed by chop scores poorly), while a modest but relentless grind scores near the extremes. Because correlation is scale-free, thresholds transfer across instruments and timeframes far better than slope-based measures, whose units depend on price level and volatility.
CTI is closely related to the R-squared trend fit: squaring CTI gives the R-squared of the same linear regression, discarding the sign. Traders use CTI when they want strength and direction in one bounded number, and R-squared when direction is handled elsewhere. Like every windowed statistic, it is entirely backward-looking: a perfect +1 describes the last n bars, not the next n.
How it's calculated
CTI is the Pearson correlation between the source series and a straight rising line (the bar index) over the lookback:
Orient the index so that a rising market yields positive CTI; implementations differ on whether they correlate against i or -i and flip the sign accordingly.
The result is identical to the signed square root of the regression R-squared over the same window.
How traders use it
- As a regime gate: only take trend-following entries when CTI is above a positive threshold (commonly around +0.5) or below the negative mirror, and stand down or switch to mean-reversion logic near zero.
- As a direction-plus-quality score in one number, replacing the two-step check of an average's slope plus a separate strength measure such as the ADX/DMI system.
- Zero-line crossings are sometimes traded as trend-change signals; these lag the actual turn by a meaningful fraction of the window, so they suit confirmation rather than timing.
- Its limitations are structural: a single large gap inside the window distorts the correlation, V-shaped reversals pass through zero late, and the reading says nothing about the magnitude of the drift, only its consistency.
CTI vs other trend-strength measures
R-squared trend fit: R-squared is CTI squared: same regression, direction discarded, output 0 to 1. CTI keeps the sign, so one series carries both strength and direction.
ADX/DMI system: ADX measures trend strength from smoothed directional movement and is famously slow to rise and fall. CTI is a direct windowed fit with a hard bound at 1, typically snappier but noisier at short lookbacks.
Kaufman efficiency ratio: The efficiency ratio scores net displacement against path length, so one big bar can dominate it. CTI scores linearity of the whole path, so it rewards steady grinds over jumpy ones.
Concept family
Trend
100 concepts mapped · 100 in the Library
Correlation Trend Indicator FAQ
Turn Correlation Trend Indicator into a trading strategy.
Take the implementation from this page into Quant, then build on it, backtest it on real data, and keep refining it in conversation.