Death Cross
 By LuxAlgoJun 2, 2026
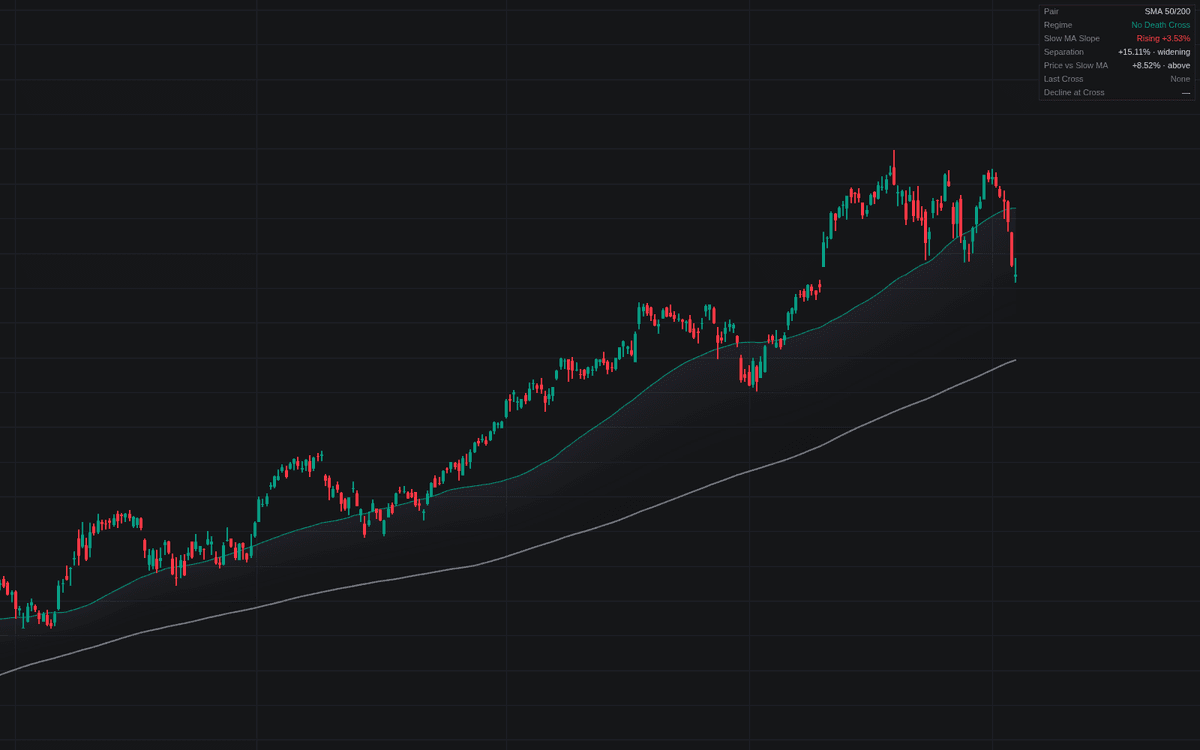

Death Cross plots a fast and a slow moving average (the classic 50/200 simple pair by default) and marks every bar where the fast average closes below the slow, grading each event's context. Where most treatments stop at the death cross event itself, this build reads the slow average's slope at the cross, measures the decline already consumed from the preceding regime high, flags re-crosses inside a whipsaw window, and shades the space between the averages by regime.
How to Trade the Death Cross?
- Death Cross label: the fast MA closed under the slow, a late-by-construction regime statement rather than a timing tool.
- Bearish vs caution color: a cross with the slow MA flat or falling fires the Clean Death Cross alert; one with the slow MA still rising prints in the caution color and more often marks a brief dip.
- Recovery mark: the fast MA closing back above the slow ends the standing cross; within 20 bars it is flagged as a whipsaw, the failure mode of sideways tape.
- Dashboard: separation between the averages, price versus the slow MA, and the last cross's context fill out the picture alongside the broader trend toolkit.
Death Cross Settings
- Fast Length (default 50) and Slow Length (default 200): the pair; the dashboard tags anything but 50/200 SMA daily as nonstandard.
- MA Type (default SMA): simple or exponential. Exponential weighting shifts cross dates.
- Source (default close): price series for both averages.
- Slow MA Slope Lookback (default 20): bars used to grade the slow MA's slope at the cross.
- Whipsaw Window (default 20): a recovery within this many bars of a cross counts as a whipsaw.
- Show Dashboard (default enabled) plus Death Cross Markers, Recovery Marks, and Regime Fill, all enabled by default.
Frequently Asked Questions

Original indicatorBuilt in-house by LuxAlgo
The Library is free. Quant makes it yours.
Pull any concept or indicator into Quant: rebuild it, retune it, or turn it into a backtested strategy of your own.