Concept
Death Cross
Death Cross is a Trend concept. The Library holds 1 implementation, a working definition you can pull into Quant.
Top Death Cross indicator
The top custom implementation, built on the original standard Death Cross formula.
1 total
From studying Death Cross to trading it: take the implementation below into Quant and backtest it instantly.
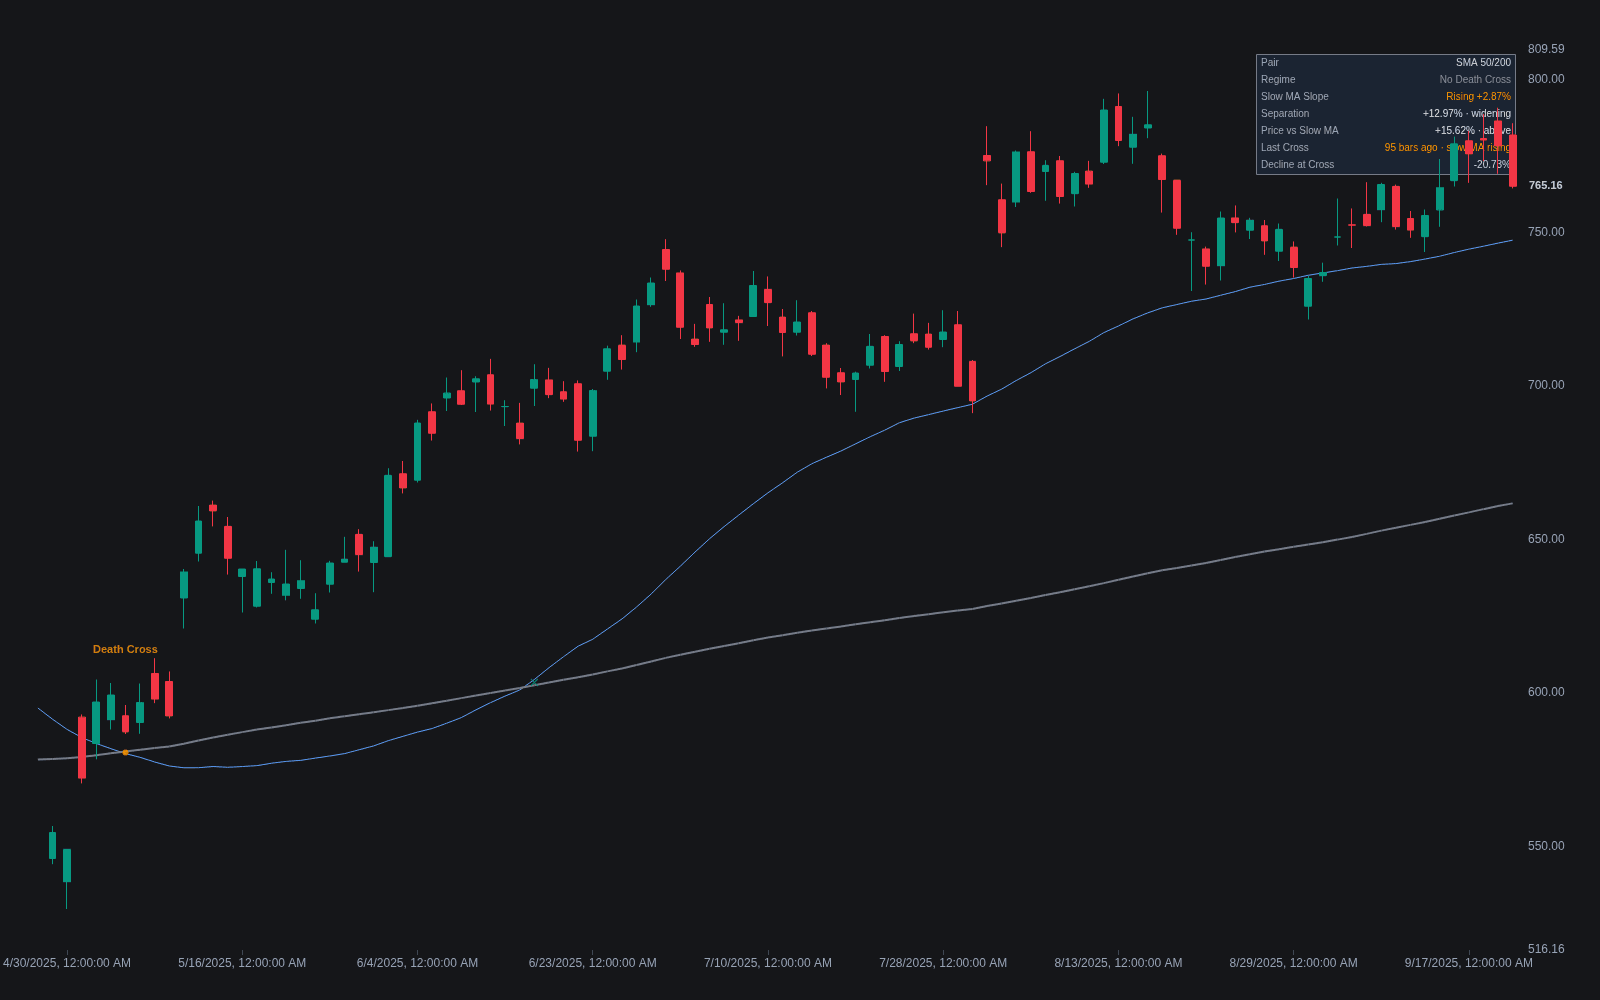
What is a Death Cross?
A death cross is the bearish counterpart of the golden cross: a shorter moving average crossing below a longer one, classically the 50-day simple moving average dropping under the 200-day on a daily chart. It records that intermediate-term price action has deteriorated enough to pull the medium average through the long-term one, which by construction happens well after the decline begins. It is a statement about regime, delivered late, not a prediction about the next few weeks.
The event is a special case of moving average crossovers that earned its own name because of the pair involved. Nothing is magical about 50 and 200, and EMA versions or weekly variants shift the timing without changing the logic. A 200-day average needs months of falling or flat prices to be overtaken, so the cross typically prints long after the peak, often after much of the decline is done. The long average's direction at the cross is a common secondary read: many practitioners discount crosses that occur while the 200-day is still rising, in the spirit of an MA slope filter.
History arms both camps. The S&P 500's December 2007 death cross preceded the worst of the financial crisis, while its March 2020 cross printed about a week after the pandemic low, early in a historically fast recovery; the March 2022 cross fell between those extremes, arriving mid-decline. Backtests echo the anecdotes: outcomes after death crosses are unstable across eras, and the event is rare enough that the sample stays thin for confident claims either way.
Its notoriety comes from the name and the headlines more than from its track record. Because it needs a prolonged fall to trigger, death crosses have printed early in extended bear markets but also near exhausted lows just before recoveries. Practitioners who use it mostly treat it as a risk flag inside a broader trend regime label, not as a standalone sell signal, and systematic trend followers accept the lag as the cost of catching the occasional large move.
How to Identify a Death Cross on a Chart
The event is objective, which is much of its appeal:
- 1Plot the 50-day and 200-day simple moving averages on a daily chart; this pair is what commentary means by the term.
- 2Watch for the 50-day to close below the 200-day, judged on the daily close so intrabar pokes do not count.
- 3Note the 200-day's slope at the cross: falling supports the bearish regime reading, still-rising warns the cross may be shallow.
- 4Measure how far price already sits below its peak; a cross arriving after a deep decline says less about the future than one arriving early.
- 5Track the state afterward: the condition stands until the 50-day recloses above the 200-day, the golden cross that ends it.
How traders use it
- As a de-risking trigger in longer-horizon portfolios: reduced position sizes, tighter stops, or hedges while the 50-day holds below the 200-day.
- As a directional filter: long setups are disabled or downweighted under a standing death cross, and short setups are given more room.
- As a screening condition to flag symbols whose long-term trend has rolled over for closer review.
- As one input in a composite regime read: the cross, price's position against the 200-day, and the ordering of an MA ribbon give a sturdier picture than the line pair alone.
- As a benchmark for faster alternatives: traders who find the 50/200 too slow test Supertrend flips or slope rules on the same history to see whether earlier signals survive the extra whipsaws.
Death Cross vs Related Trend Signals
Moving Average Crossovers: The general mechanism; the death cross is one celebrated instance with fixed lengths and a fixed direction. The lag, the whipsaw in ranges, and the dependence on the length pair all apply here in their slowest form.
MA Slope Filter: Reads one average's direction instead of two averages' order. A slope rule on the 200-day can flag regime change without waiting for the 50-day to travel, sometimes leading the cross by weeks.
Supertrend: A volatility-banded trend flip rather than an average pair. Supertrend reacts to price and ATR directly, so it flips faster and whipsaws more; the 50/200 cross is the deliberate, slow end of the same trade-off.
Trend Regime Label: The broader practice the cross feeds into: a maintained bull, bear, or neutral state built from several inputs. A death cross is one vote inside such a label, not the label itself.
Concept family
Trend
100 concepts mapped · 100 in the Library
Death Cross FAQ
Turn Death Cross into a trading strategy.
Take the implementation from this page into Quant, then build on it, backtest it on real data, and keep refining it in conversation.