Monte Carlo Expected Move Distribution
 By LuxAlgoFeb 19, 2026
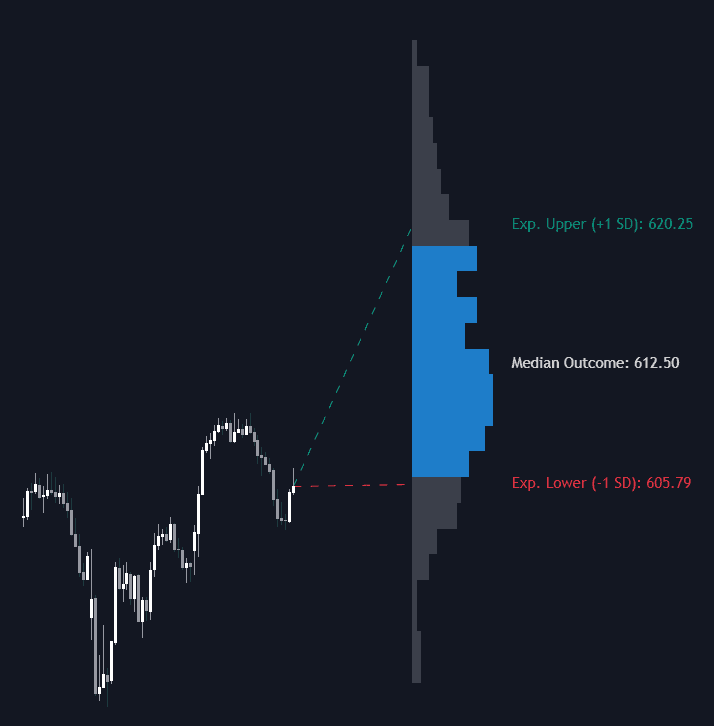
The Monte Carlo Expected Move Distribution is a forward-looking trading indicator that uses Monte Carlo simulation and Geometric Brownian Motion (GBM) to project hundreds of possible future price paths. Instead of relying on a single forecast line, it builds a full probability distribution of where price is statistically expected to trade over a chosen timeframe, helping traders make decisions based on probabilities rather than predictions.
How to Trade the Monte Carlo Expected Move Distribution Indicator
This trading indicator generates a forward “Expected Move” profile, a concept widely used in options trading to define the statistically implied range of an asset. By simulating multiple price paths, it provides a visual probability map of future outcomes.
Rather than asking, “Where will price go?”, this trading strategy approach asks, “Where is price most likely to be?”
The result is a vertical probability distribution plotted at the end of your projection horizon, showing:
- The Median Outcome (50th percentile)
- The 1-Standard Deviation (1-SD) Expected Move range
- The low-probability “tails” beyond ±1 SD
This probabilistic framework makes it easier to structure realistic price targets, stop-losses, and volatility-based trade plans.
Setting Realistic Price Targets with Probability
At the end of the projection window, the histogram reveals the distribution of all simulated outcomes.
The Median Outcome (50th percentile) represents the statistically most balanced result given current volatility and optional trend bias (drift). This level can serve as a neutral reference for price expectation.
You can structure trades using probability tiers:
- Conservative Targets: Aim inside the highlighted 1-SD “Expected Move” zone (≈68% probability).
- Moderate Targets: Slightly beyond the median but still within the colored distribution.
- Aggressive Targets: Levels deep in the gray “tails,” which are statistically less likely to be reached within the selected timeframe.
This makes the indicator ideal for swing trading, intraday trading, and options positioning where expected range matters.
Identifying Overbought and Oversold Conditions Statistically
The dashed projection lines mark:
- Upper Expected Move (+1 SD)
- Lower Expected Move (-1 SD)
If price reaches these levels early in the projection window:
- Upper Expected Move Hit Early: Price may be statistically overextended relative to current volatility.
- Lower Expected Move Hit Early: Price may be statistically oversold beyond normal fluctuation expectations.
This provides a volatility-adjusted framework for identifying potential mean reversion setups or managing open trades.
Understanding the Distribution Profile
The vertical histogram (price bins) on the right side of the chart shows the density of all Monte Carlo simulations.
- The widest section of the histogram = highest probability price zone.
- Narrow upper/lower sections = lower probability tail events.
- Colored region = 1-SD Expected Move (~68% of outcomes).
- Gray regions = statistical outliers (~32% combined).
This visual structure helps traders instantly see whether their trade idea sits in a high-probability zone or a low-probability extreme.
How to Use This Trading Indicator Effectively
To align the Monte Carlo model with your trading strategy, follow these steps:
-
Define Your Horizon:
Set the “Projection Length” to match your trade duration. For example:- 5 bars for scalping
- 20–50 bars for swing trades
The distribution dynamically shifts further forward as the horizon increases.
-
Evaluate the Drift (Trend Bias):
Enable “Include Trend (Drift)” if you believe momentum will continue.
Disable it if you expect sideways or mean-reverting behavior (random walk assumption). -
Analyze Probability Zones:
If your target lies inside the colored 1-SD zone, there is approximately a 68% statistical probability of price reaching that region within the selected timeframe (based on current volatility). -
Improve Risk Management:
Use the Lower Expected Move (-1 SD) as a volatility-based stop guide for long trades.
In short trades, the Upper Expected Move (+1 SD) can act as a statistical invalidation level.
This transforms the indicator into a structured risk-to-reward planning tool rather than just a forecasting model.
Indicator Details and Statistical Model
This trading indicator is powered by Monte Carlo simulation using Geometric Brownian Motion (GBM), a widely used stochastic model in quantitative finance.
The model incorporates:
-
Log-Volatility
Calculated from the standard deviation of historical log returns. This determines how wide the simulated price paths spread. -
Drift (Optional Trend Component)
Derived from a moving average or trend approximation, adding directional bias to the simulation.
The “Expected Move” range is defined as the 1-Standard Deviation band (16th to 84th percentile). In a normal distribution, roughly 68% of outcomes fall inside this range. The script highlights this zone in color, while the remaining 32% (tail risk) appears in gray.
By combining volatility modeling with probabilistic forecasting, the indicator bridges technical analysis and quantitative trading methods.
Settings
Monte Carlo Simulation Parameters
-
Simulations
Number of simulated price paths (50–500). Higher values create smoother and more statistically stable distributions. -
Projection Length
Number of future bars used to calculate the Expected Move. -
Volatility Lookback
Period used to measure historical volatility from log returns. -
Include Trend (Drift)
When enabled, simulations incorporate directional bias.
When disabled, the model assumes a mean-neutral random walk.
Distribution Visual Settings
-
Price Bins
Controls the vertical resolution of the histogram. More bins = finer probability detail. -
Distribution Color
Defines the color of the 68% Expected Move zone. -
Max Distribution Width
Controls how wide the histogram appears on the chart.
Why Use a Monte Carlo Trading Strategy?
Traditional technical indicators give reactive signals based on past price. This Monte Carlo trading indicator adds a forward-looking probability layer, helping traders:
- Quantify expected volatility
- Structure statistically grounded targets
- Avoid unrealistic profit expectations
- Recognize low-probability tail events
- Align stop placement with market volatility
It is especially useful for:
- Options traders analyzing expected range
- Swing traders planning multi-day moves
- Crypto traders navigating high volatility
- Risk managers optimizing position sizing
By focusing on probability instead of certainty, traders can develop more consistent and disciplined strategies.
FAQ
What is the Monte Carlo Expected Move Distribution indicator?
It is a probabilistic trading indicator that uses Monte Carlo simulation and Geometric Brownian Motion to forecast a distribution of potential future prices and highlight the 1-Standard Deviation expected move.
How is the Expected Move calculated?
It is derived from simulated price paths based on historical log-volatility and optional drift. The highlighted zone represents the 16th to 84th percentiles (≈68% probability range).
Is this indicator suitable for scalping?
Yes. Simply reduce the Projection Length to match short-term trading horizons such as 3–5 bars.
How do I access the Monte Carlo Expected Move Distribution indicator?
You can get access on the LuxAlgo Library for charting platforms like TradingView, MetaTrader (MT4/MT5), and NinjaTrader for free.
Free indicator
Get free access to this indicator on the platforms below.

Unlock the entire LuxAlgo Library
Every indicator, every strategy, full charts, and complete access to Quant — our AI agent.