Concept
Probability Cones
Probability Cones are Statistics concepts. The Library holds 5 implementations, each one a working definition you can pull into Quant.
Top Probability Cones indicators
The top custom implementations, built on the original standard Probability Cones formula.
5 total
Any of the 5 Probability Cones implementations below can become a backtested trading strategy — describe your rules and Quant writes the code.
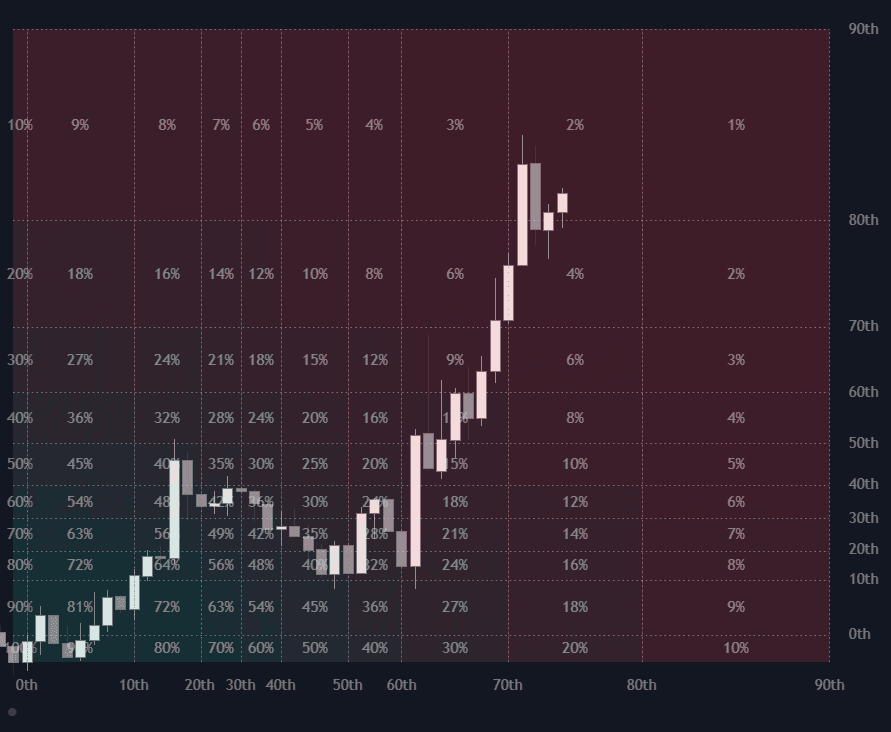
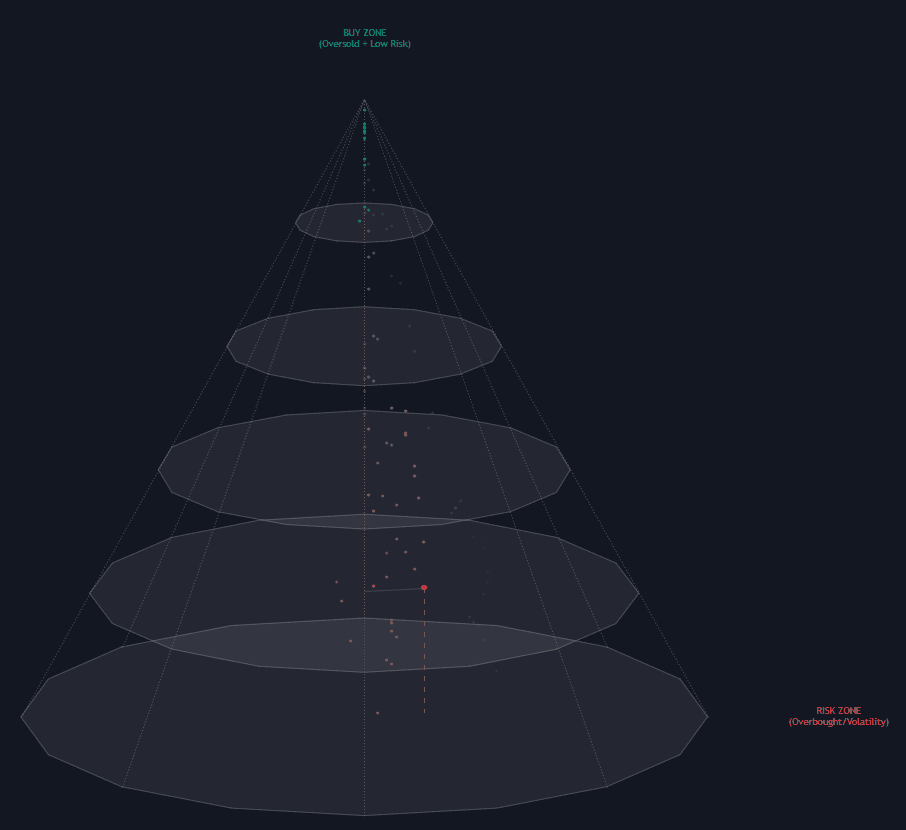
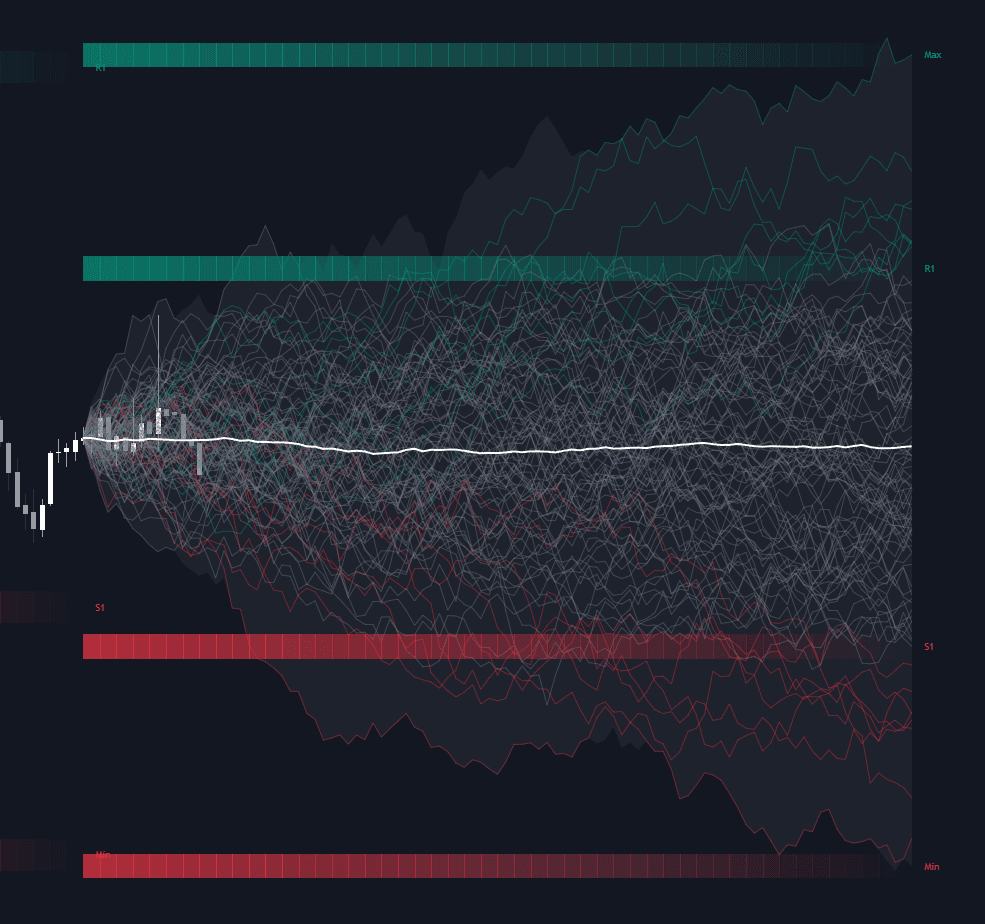
What are Probability Cones?
Probability cones are forward-projected envelopes, anchored at the current price, an entry, or an event, that show where price is statistically expected to remain at chosen confidence levels. The width scales with a volatility input, either realized volatility from recent history or implied volatility from options, and grows with the square root of elapsed time, because under independent returns the variance of the cumulative move accumulates linearly with time.
Confidence labels come from a distributional assumption. Under a normal approximation, an envelope of one standard deviation covers roughly 68 percent of outcomes and two standard deviations roughly 95 percent; cones can also be built empirically as percentile bands over Monte Carlo price paths. Real returns are fatter-tailed than normal, so actual breach rates run higher than the labels suggest, and a cone edge is a statistical boundary, not support or resistance.
No single author owns the construction. The square-root-of-time core descends from Louis Bachelier's 1900 random-walk thesis and became standard machinery with the lognormal Black-Scholes framework in 1973. Options platforms later turned the math into a chart object: the cone is the visual form of the 'expected move' quoted around earnings and expirations.
The construction is simple enough to audit: annualized volatility is rescaled to the horizon (sigma times the square root of time), multiplied by a z-score for the chosen confidence, and projected from the anchor, with drift usually ignored because expected return is tiny next to dispersion. Where normality fits badly, empirical variants substitute percentile bands from the asset's own distribution of returns, and filter models such as the Kalman filter supply a forecast variance of their own. The cone's value is honesty about uncertainty: a widening set of outcomes instead of a point prediction.
How to set up a probability cone on a chart
Cones are configured rather than spotted; settings decide whether the envelope means anything.
- 1Pick the anchor: the current bar for a general forecast, your entry for trade planning, or a scheduled event like an earnings date.
- 2Choose the volatility input: historical volatility over a lookback comparable to the horizon, or implied volatility when the horizon matches an expiry.
- 3Set the confidence levels: one and two standard deviations are conventional, while percentile bands avoid the normality assumption where tools support empirical cones.
- 4Read the width at your horizon, not the chart's edge: the band prices on your intended exit date are the expected-move estimate that matters.
- 5Track the realized path against the cone: riding an outer band or escaping early means volatility is running hotter than assumed and the plan is stale.
How traders use it
- As an expected-move frame for options horizons: comparing a target against the cone implied by option pricing shows whether the trade needs an outsized move by the market's own estimate.
- As a realism check on stops and targets: a target sitting outside the cone for the trade's intended horizon is, under the model, a low-probability outcome, which argues for resizing the trade or allowing more time.
- As post-entry context: price hugging or escaping the cone flags a move that is large relative to the volatility regime the cone assumed, often a prompt to reassess the position.
- As a sizing translator: the cone turns a volatility estimate into concrete prices, so size can be set such that an ordinary one-standard-deviation excursion against the position stays within the risk budget.
- As a model check: overlaying a normal-assumption cone with an empirical one from the same history makes fat tails visible, and positive autocorrelation in returns shows up as breach rates running above the labels.
- As a regime dashboard: comparing the current cone's width against past anchors, normalized with a percentile rank, shows whether present uncertainty is historically stretched or compressed.
Probability Cones vs related concepts
Monte Carlo Price Paths: A cone is a summary; a simulation is the raw material. Monte Carlo methods generate thousands of hypothetical paths, and percentile bands across them form an empirical cone. The parametric version skips simulation by assuming a distribution up front.
Linear Regression: A linear regression channel is fitted to past prices, describing a trend that already happened with parallel bands of constant width. A cone is anchored at a point and projects forward, widening with time. One is descriptive, the other a forecast envelope.
Exponential Smoothing Forecasts: Smoothing models produce a central point forecast, with uncertainty added as prediction intervals. A probability cone usually skips the point forecast: it centers on the anchor and models dispersion alone. One commits to a path, the other brackets the possibilities.
More Probability Cones implementations
Concept family
Statistics
46 concepts mapped · 46 in the Library
Probability Cones FAQ
Turn Probability Cones into a trading strategy.
Take any implementation from this page into Quant, then build on it, backtest it on real data, and keep refining it in conversation.